Add percentage to SAP webi chart legend
SAP has an array of BI products, which is comparable to Microsoft stack. Check the following table for comparison. I have been using SAP BI Webi to create some annual reports for a client. I am impressed by its section feature and how easy to create a summary and detail break down report. In SSRS you would have to add code for summary and use group feature to do that. It also has variable feature which like expression in SSRS make it more flexible to handle different situation.
| Function | Microsoft | SAP |
|---|---|---|
| ETL | SSIS | Data Service |
| Data Model | SSAS Mutlidimensional or Tabular | Universe |
| Reporting | SSRS, PowerBI | Webi, SAP dashboard,Design Studio |
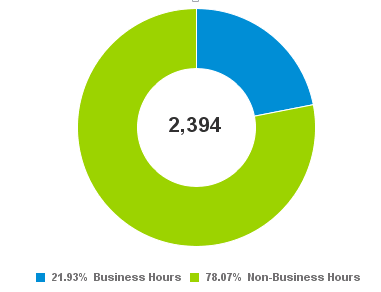
I received one request from a client, which needs to show calculation in the legend. Like what the chart shows below
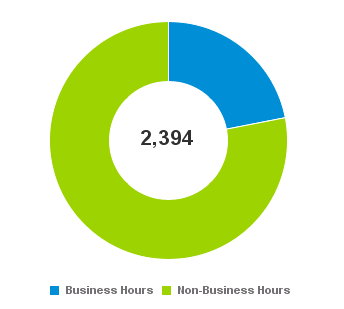
What they want
Legend shows percentage i.e. 20% Business Hours
As you might know, legend is where you show series label. Those are not measures, how do I make measure into legend? I was struggled for a while, one of my colleague gave me a hint. I finally make this happen. This is how.
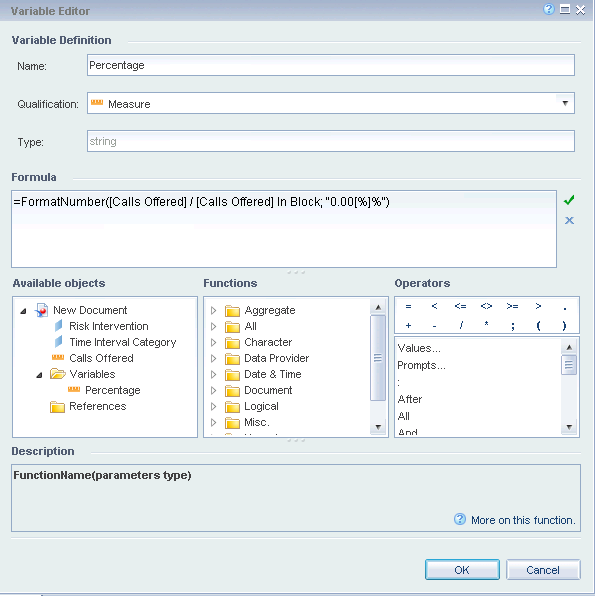
First, create a percentage measure variable in the report variable section. Set the variable like this. Pay attention to the webi syntax for percentage. Also, you want to use “in block” so that you can compare part to total.
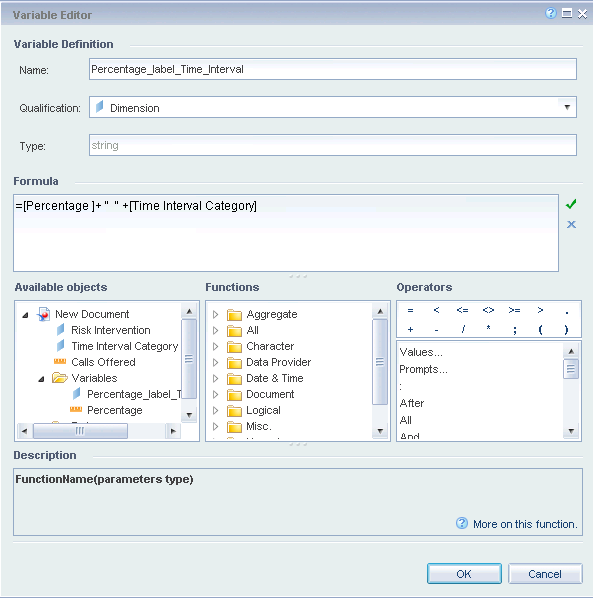
Next, we create a dimension variable to use this measure. Here you set percentage and series label side by side
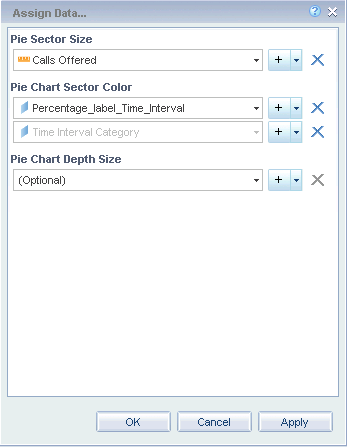
Finally, right click the chart, in the assign data section, you originally see like this. You can see calls were divided by time interval category
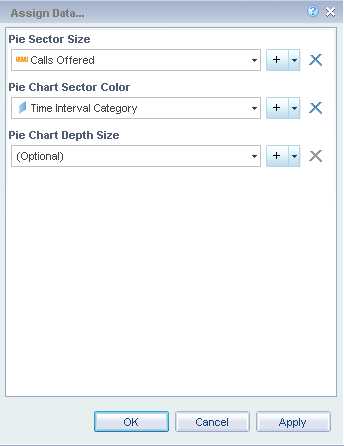
You need to add your new dimension variable in like this, but hide the original one. Otherwise, you will show extra label, but don’t try to delete the oringinal one. Deleting the one will cause issues.
Now you have it.
thanks.
Wenlei