Custom Python Functions Used in Exploratory Data Analysis
A thousand miles begins with a single step. Similarly, any fancy machine learning begins with exploratory data analysis (EDA). Because of that, you would think there will be a lot of resources for this. Surprisingly, it is not. Let us google the best book for EDA. Here are two top links for EDA from google search.
https://www.kaggle.com/getting-started/173448
https://www.quora.com/What-is-a-good-book-on-exploratory-data-analysis
The first link gave us a few more kaggle links with some experts in the field sharing their notebooks, which did enlighten me quite a bit. In the second link, a few people mentioned a book authored by John Tukey, named “Exploratory Data Analysis”. This book was first published in 1977. I don’t question the theory of the book. But it will not teach you too much about using python to do EDA.
After reading a few Kaggle articles and data science blogs, I think the following links are very helpful. They provide different perspectives that how others do this part. You might want to read it over.
- regression
https://www.kaggle.com/code/pmarcelino/comprehensive-data-exploration-with-python/notebook
- classification plus methodology minimal model to chubby model and monitor model performance
https://www.kaggle.com/code/pmarcelino/data-analysis-and-feature-extraction-with-python/notebook
- NLP
https://towardsdatascience.com/sentiment-analysis-with-text-mining-13dd2b33de27
- visualize variable relationship
https://towardsdatascience.com/exploratory-data-analysis-eda-python-87178e35b14
I personally do not like to keep repeating myself. But if you have a different project, you might have to repeat the similar process. Therefore, I would like to make those commonly used processes into functions. So that, I can just save the function somewhere and call it when I need it.
In this blog, I would like to share how I go about doing EDA using the Titanic dataset. I just started my collections, these functions are not fully tested. So they might be buggy. Please let me know if you have issues.
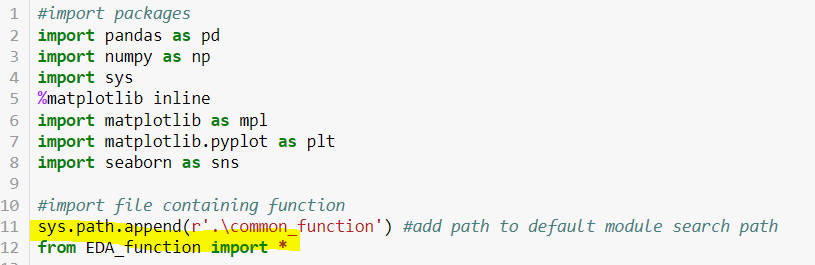
First I imported common packages, then added the function folder to the module search path at row 11 so that the system could find the function file. Then import EDA_function.py file at row 12. This file contains all functions needed. Please change your folder accordingly (either absolute or relative path will do).
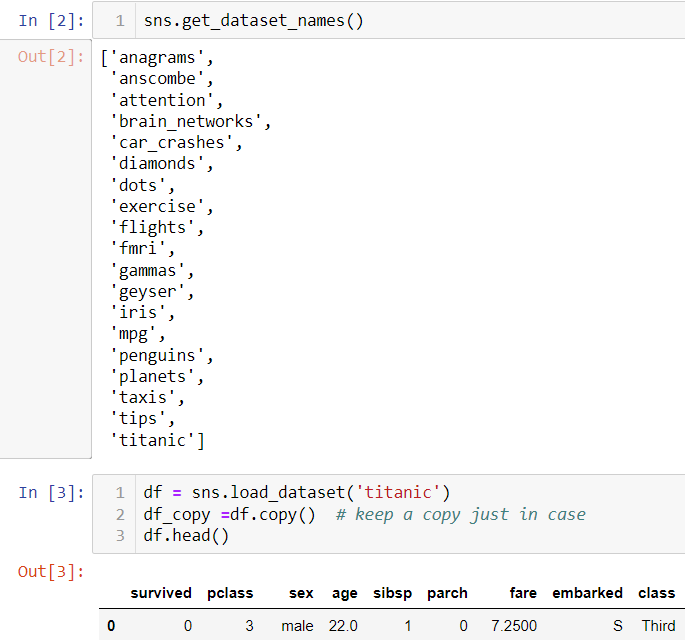
Seaborn has some built-in datasets. I will use the Titanic dataset as an example.
I am going to touch several aspects of EDA
- overall EDA
- further EDA on data variation and dup
- further EDA on data missing or inf (inlier)
- further EDA on data with outlier
- further EDA on feature correlation
- further EAD on feature selection
1. overall EDA
You will probably use df.info() or df.describe(). Since this will be run back to back. I combined them into one function.
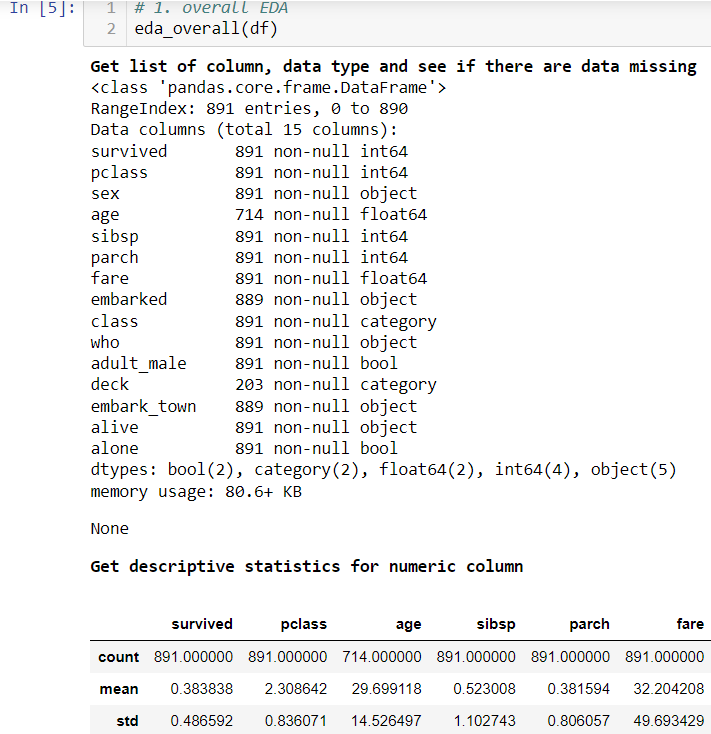
This gave you an overview of data. From the first result, you will see if there are missing value issues and data type. The second result is only about numeric variables. You can see how data is distributed and if there are any outliers.
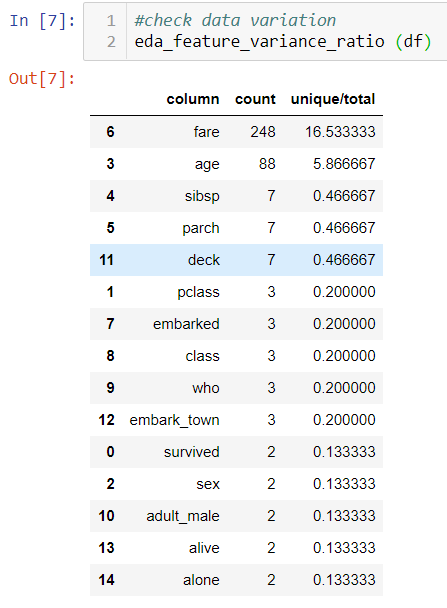
2. Data variation and duplication
If you are not checking this, you might not believe the dataset contains duplications.
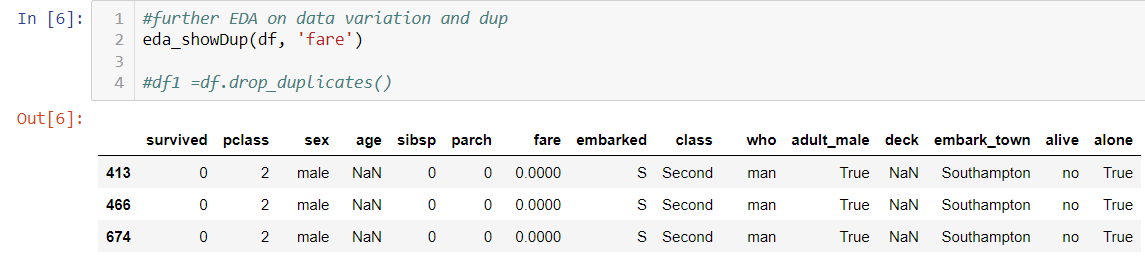
If a variable only has one value, it can be removed because it will not contribute anything to the machine learning process. In the Titanic case, the least one contains 2. So it is likely a binary variable. But it is not uncommon to find a column that only contains one value in real life dataset.
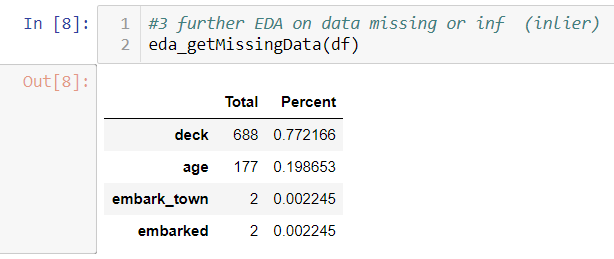
3. Data missing or inf
Custom functions only list variables containing NaN value. If too many are missing, you might want to remove this variable like “deck”. If too few are missing, you can delete those particular rows like “embarked”. For “age”, you might want to impute with average or other strategies. (please check the classification blog above, it is impressive).
You might find infinite in the overview result. This could happen because the data source did some calculation which divides by 0. Do not be surprised, this does happen when you deal with real life data.
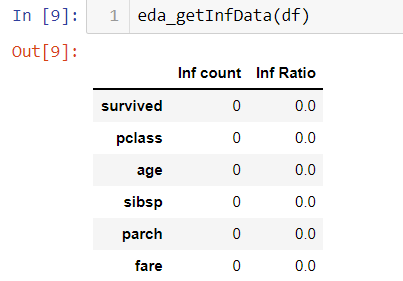
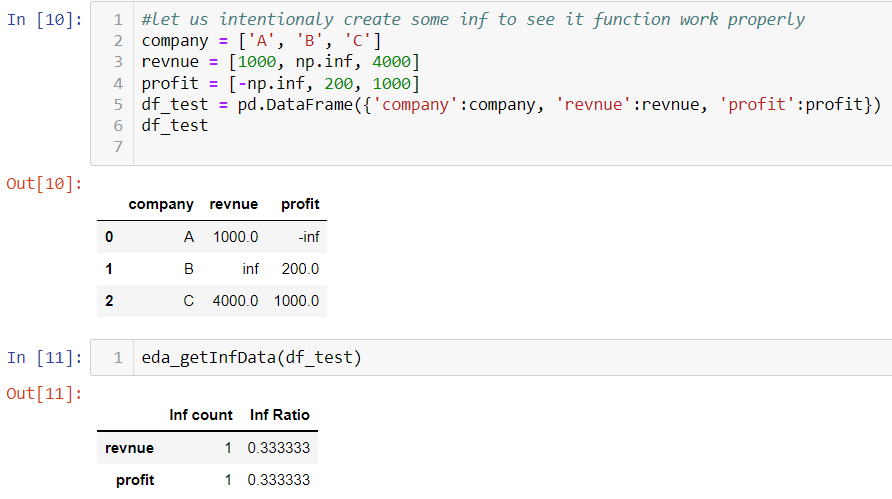
The Titanic dataset does not have inf value. I manually create a fake dataset, which proves the function works as expected.
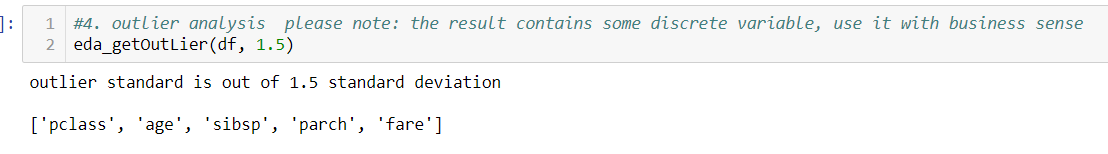
4. Outlier
Depending on how you define outliers, here I use 1.5 standard deviation. The column list is as follows. Please note: there are some discrete variables. Although I plan to programmatically remove it. But there are no easy functions to tell discrete variables. So you have to use your business sense to remove those manually.
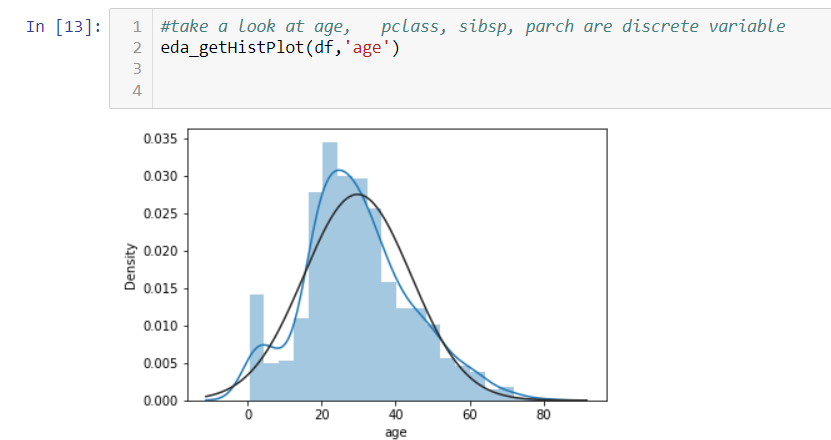
The following function can show a histogram with a normal curve. Looks age follows normal distribution more or less.
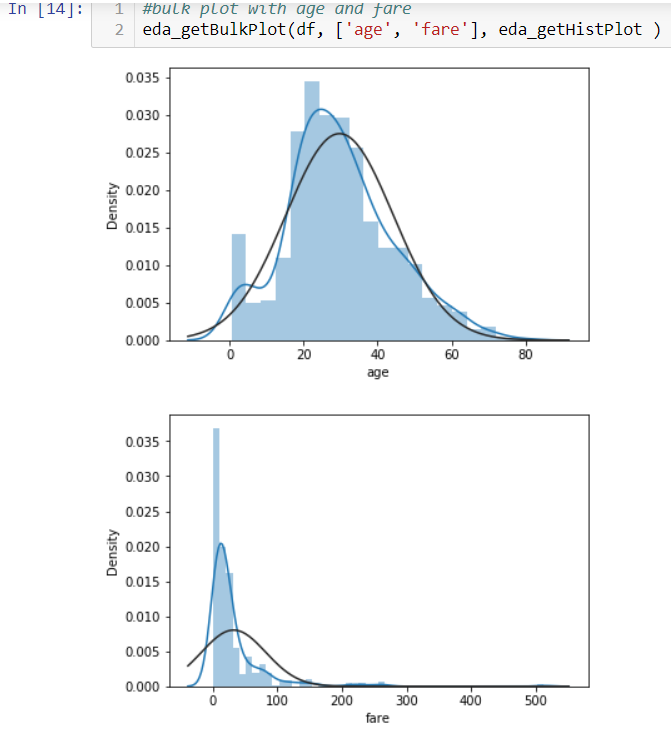
If you are tired of showing plots one by one manually. Here is another function,which helps you show them in bulk. Looks fare does not follow normal distribution. There are multiple ways to handle outlier and non normal distribution, such as log transformation. The blog above has some details.
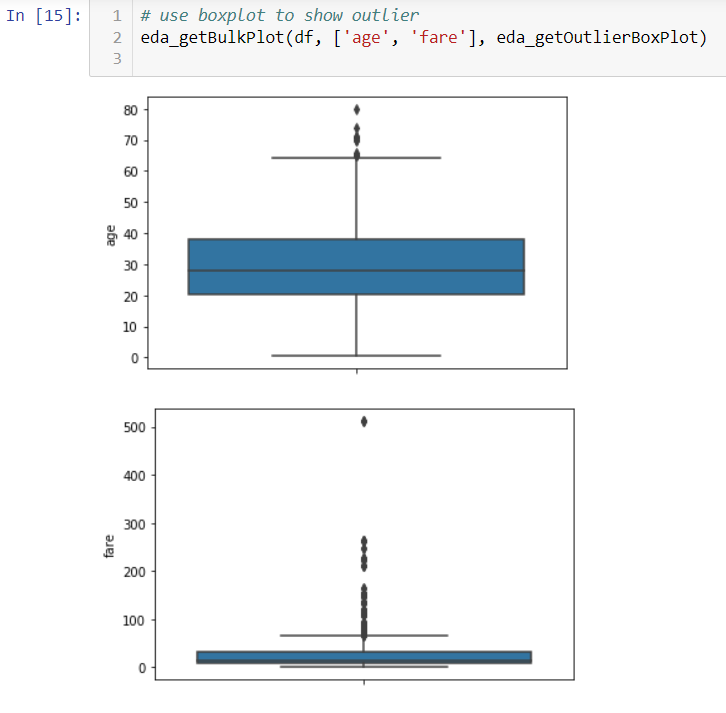
You can bulk boxplots to see where you can find outliers. There are one over $500 fare.
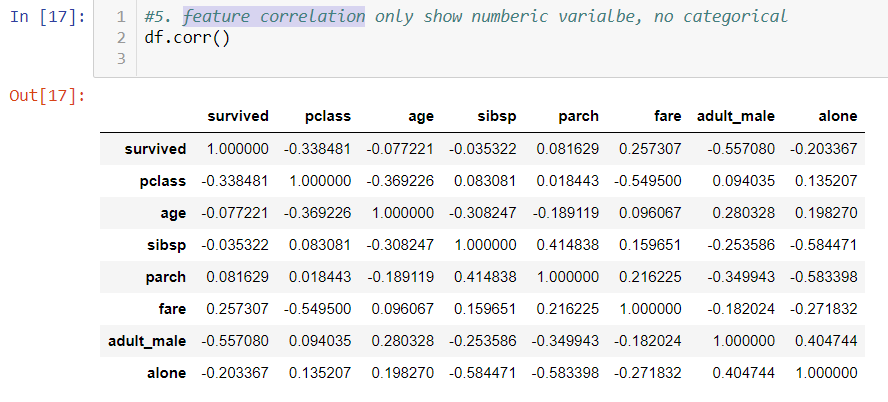
5. feature correlation
Dataframe built-in function show all numeric correlation.
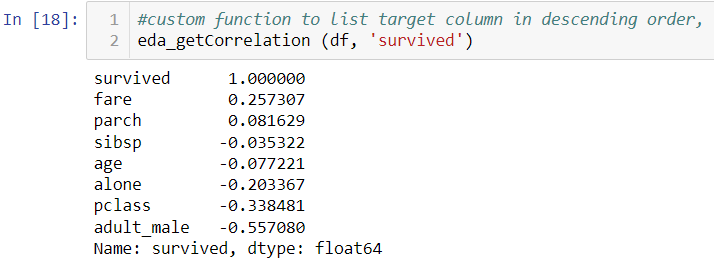
If you want to show only correlation with the target variable. This custom function will list all in descending order. Looks like “fare” has higher correlations with survival. Money talks. Adult_male have a higher negative correlation with survival. Poor man!
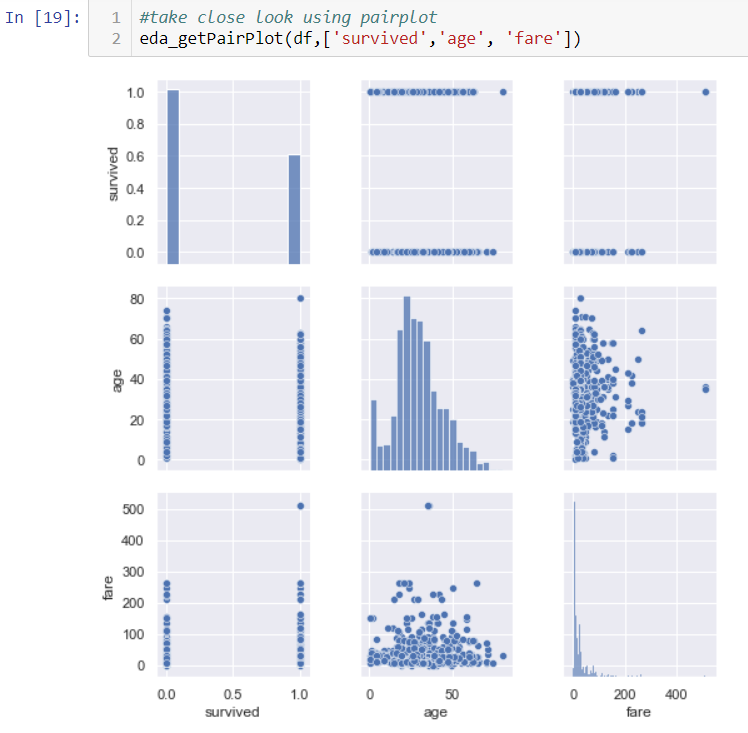
You can take a close look using pairplot
Another useful plot is heatmap.
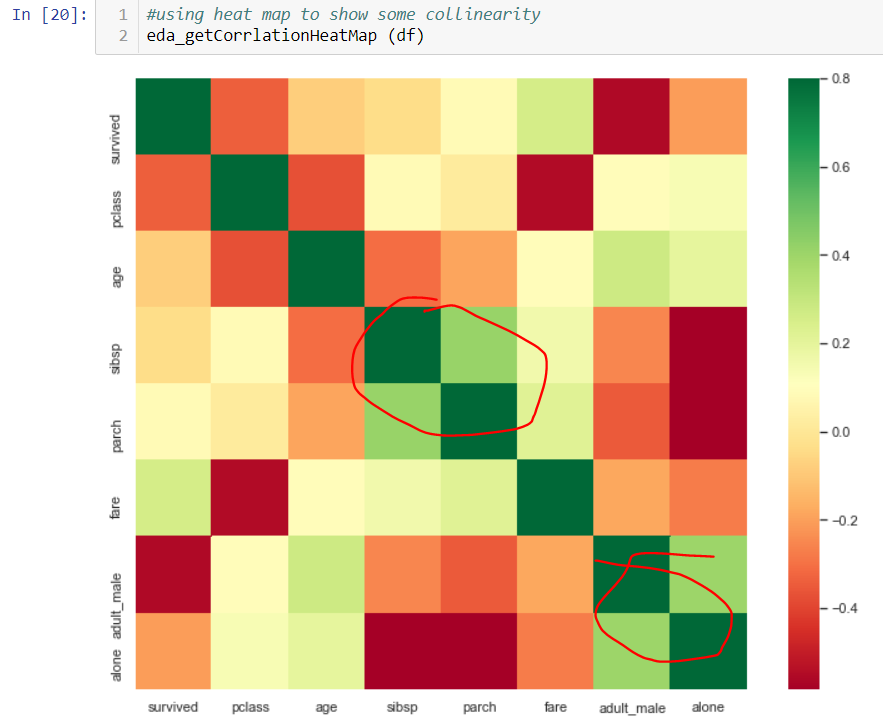
Notice parch and sibsp, adult_male and alone are relatively highly correlated. Sometimes, because of these collinearity, you can just choose one variable to include in your analysis.
Another way to observe the relationship between variables is to use a scatter plot for two numeric variables. If it is one numeric and one categorical, you can use a bar chart to compare. These two blogs (blog1, blog2) give some good examples.
6. Use statistical method to select feature
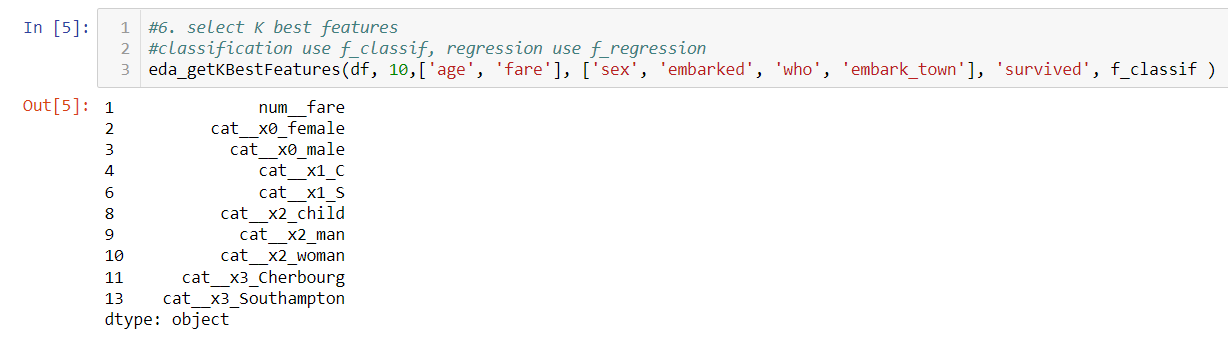
You want 10 most important features. Here numeric features and categorical features need to be inputed and one-hot encoded to be able to use selectK feature function. Therefore you need put numeric and categorical into different lists
The result gives some hints. Looks fare is important here too, sex is also important factors.
I hope these functions could help you save some time and guide you do EDA in a systematic fashion.
Of couse, I could miss some important part here. but please let me know.
The notebook can be showed here. The function file can be downloaded here.
Thanks and keep safe.
Wenlei