Show D3 and React Visualization in Github Page
Let us say, you create some javascript data visualization somewhere and you would like it show in Github page site. Is it possible? The following is Massachusetts county map, I created with D3 and react in javascript. The legend is interactive if you hover mouse over it.
This is basically the html behind the image. you need to save js to somewhere and point the source to that path in your html.

However, there are still some space between the js chart and text following it. I have no clue why there are space, but looks to me it is about the same size of html code behind scene. Some experts might have answer to it.
I had some other visual created in D3 and React which I presented in the following youtube video if you are interested.
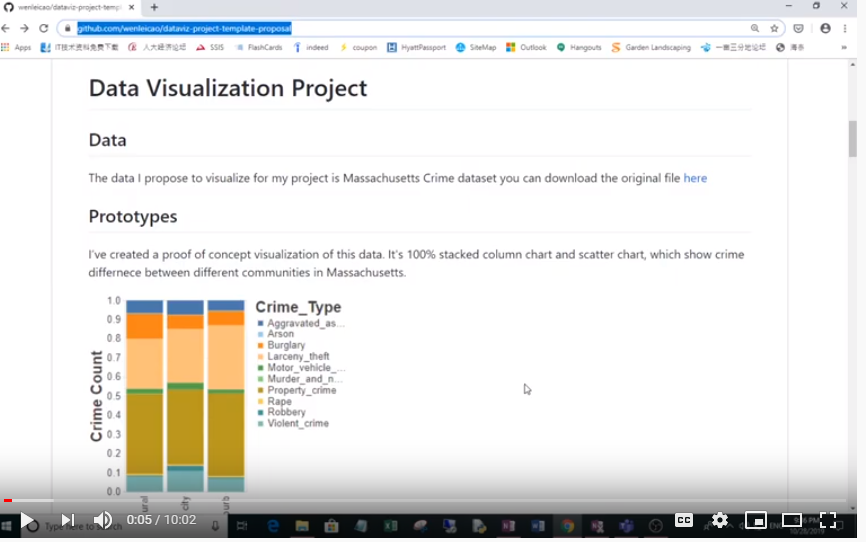
For javascript code, you can visit the following link, click the image, you will be able to see source code in vizhub file. https://github.com/wenleicao/dataviz-project-template-proposal
Again Happy BIing.
Wenlei