Deal with complex DAX measure
If you are working on tabular model, power BI, or Excel pivot table, you probably are familiar with DAX. Although DAX seems like excel expression, I have experienced many frustration moments. You might be asked to create measure like sum(value). But every so often, you will be requested to create something much more complex than that. I don’t see many book teach you how to deal with that. I will use an example to show you my approach to solve a complex measure.
I was asked to help with a DAX measure about creating third available appointment date. This is for helping someone scheduling patient appointment. Just so you know, it is common clinical practice that clinic will reserve the first and second available appointment date for emergency case. I was told the business rule is as follows,
- If patient was seen by a provider group in a particular clinic, let us call C1, but those providers also practise in other clinic (C2). If the third available appointment date located in C2, you can schedule on that date in C2.
- If patient see certain Tier provider, then you can only choose that tier. for example, only tier 1 (t1) provider allowed
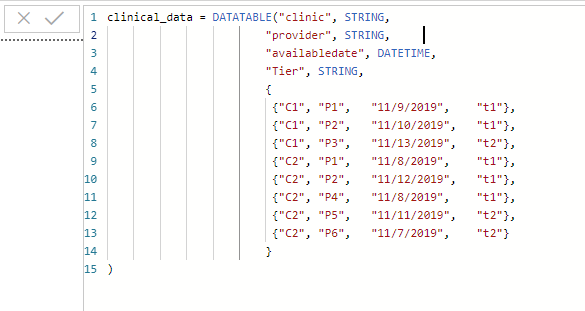
Using Datatable function, I created a table in Power BI desktop so that we can play with.
These are pseudo processes for creating measure
- a. I need to isolate the records which can be use for rank the availabledate. Assuming we are choose C2 and T1. If I write it in SQL, it will be as follows Select * from clinical_data where provider in (Select provider from clinical_data where clinic = ‘C1’ and Tier = ‘t1’)
- b. With records in hand, I can use the rank function to rank the record and get the record with rank =3
- c. It is possible there are a couple of appointments with rank =3. In that case, we can use concatenatex function to loop through the result and provide a list of physican and date
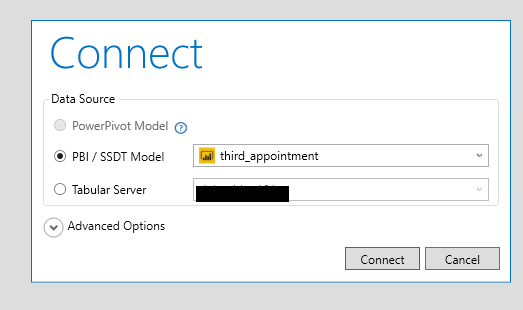
I prefer to do all these research in DAX studio (by the way, thank SQLBI for this great tool) let us save the pbix file as as third_appointment.pbix. with Power BI file open, you can use Dax studio to connect to this file.
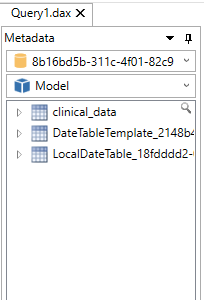
Now, in DAX studio, you can see the following tables in the model, not sure why there are localDatetable and datatabletemplate. But we are going to only use clinical_data table. You can write dax against this table.
a. Get all eligible providers under certain filter context (here we assume filter context is clinic = ‘C2’ and Tier = ‘t1’)
First step, I will use Calculatetable function to enforce the filter context I will encounter, let use say, user chose C2 and t1.
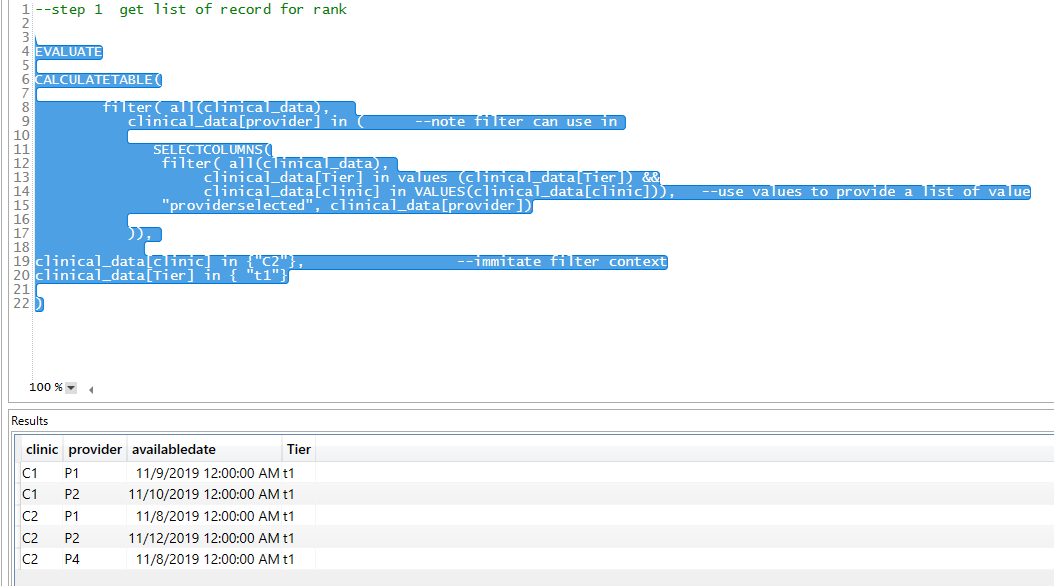
Please note: I am using dax to mimic what SQL did in the first step. Because filter context, C2 and T1 were passed in, but provider will also need to include provider who practice at C2 and other clinic. So, I use all function to ignore the filter context. You can see providers who are in t1, C2 also practise in C1. The results also include those records.
b. rank based on availabledate
You can use Rankx to do that, the syntax is following Rankx( ‘selected record’, calculate(min(availabledate)), ,asc,dense) Here I use calculate function to enforce the ouside filter context, asc indicating rank is based on availabedate in ascending order. If there are multiple records with same value, the result will not leave gap. For example, if there are 4 records, 1rd and 4th record rank are the same at first place, it will be 1, 2, 3, 1 not 1, 3, 4, 1.
I want to have all column and additional column name as rnk
![]()
Notice between line 32 and 39 is selected record from the first step. I add another column at line 31, then name is rnk and value from rankx() between line 41 and line 49. The first param of rankx function is the selected record, so the selected record code block appeared twice. Maybe we can refactor it to make the readability better. Let us make the selected record as DAX variable
![]()
As you can see, I put selected provider into a var and then use var in the dax code, this makes logic much easier to understand. Now I just need to pick the record with rank =3, I can simple add filter to this. Next question is what if there are multiple record all rank =3? We want to present the users with format like this P1 clinic location datetime, p3 clinic location datetime, …
c. create measure be able to handle multiple records
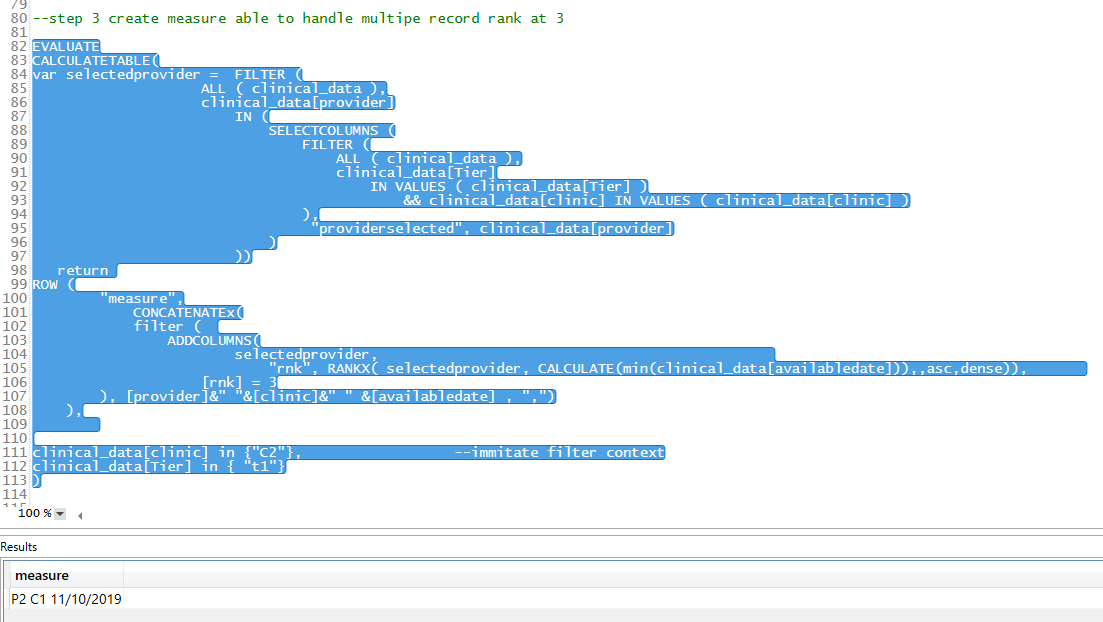
At line 102 and line 106 I filtered record and keep rank =3. At line 101 and line 107, I catenate record if there are multiple record in the prevous step.The result is expected.
Can we make some improvement on this code?
In first step, I first filter the all table content with clinic and tier, but actaully because the filter context get passed in, the line 90, clinical_data is not full dataset any more, it is already filtered by clinic and tier, so there is no need to filter it again. It is kind of redudant to do that although I do that explicitly make it easier to understand the logic. I can replaced the first step with follows, it still work.
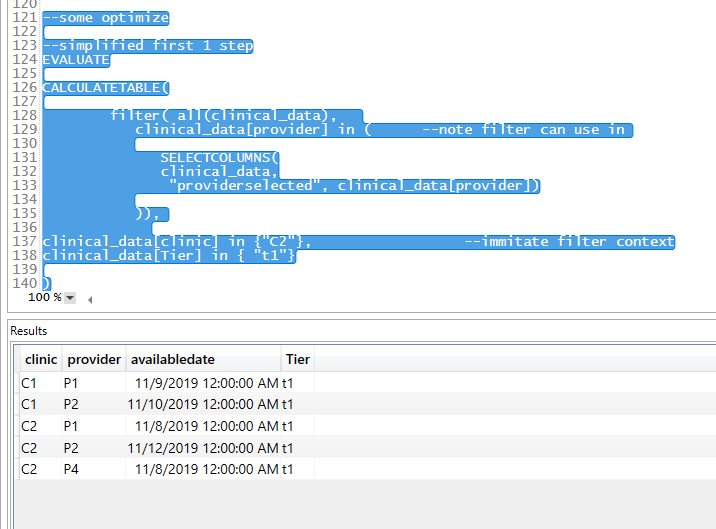
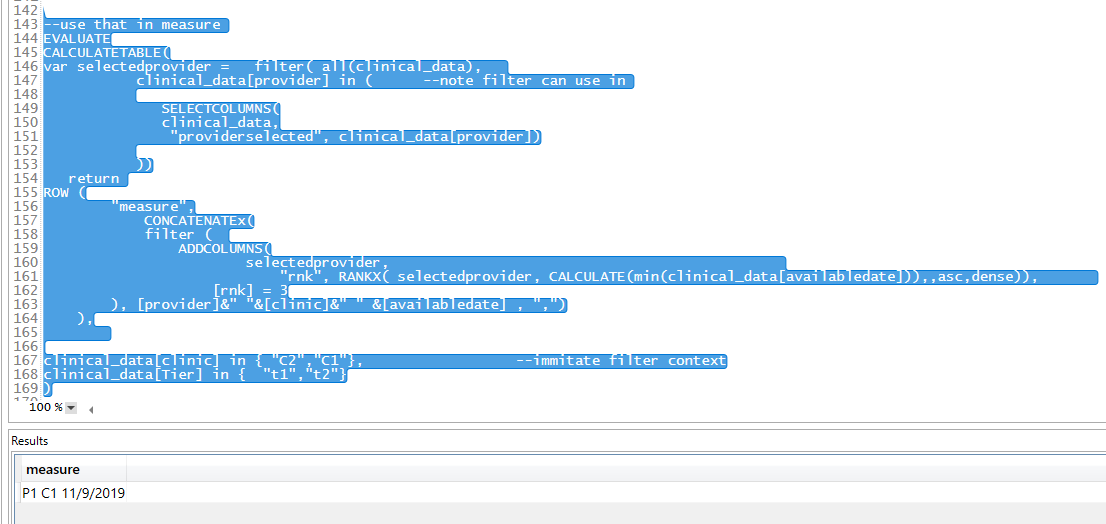
If I replace the step 1 code with new code, the final code became the follow. I test differnet scenario by change filter context in calculatetable filter, with both clinic and tiers. The result is correct. Notice here I changed filter context to C1, C2, t1, t2. The result is expected.
move measure to Power BI desktop
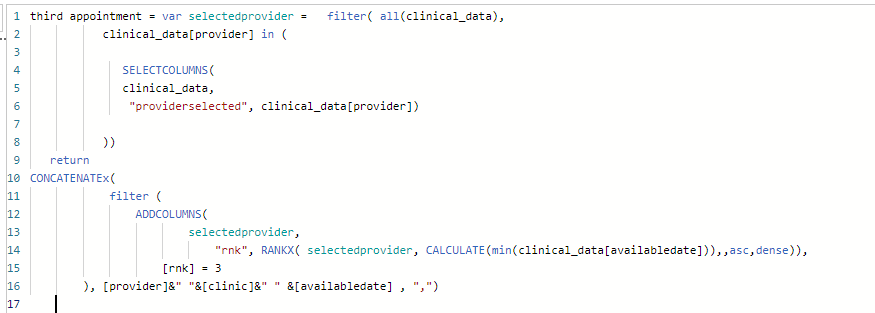
I removed the filter context, just pasted var and meaure code to create measure named as third appointment.
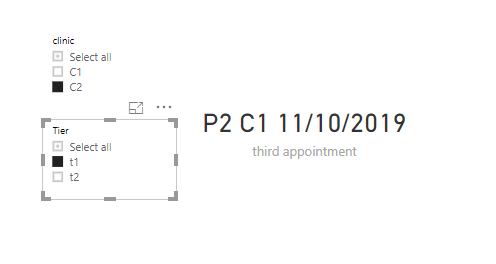
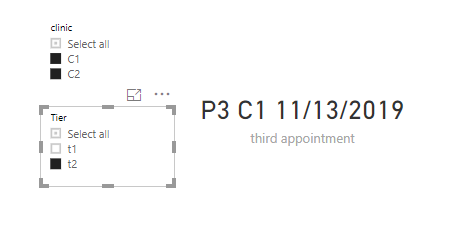
Now in the report view, I added two slicers to give measure filter context, I also added a card visual to show the third appointment availabe. I tested a few senario, it works.
test using context C2 and t1
test using context C1, C2 and t2
In summary, some measure are not so straightforward which will take some experiment to work out. Dax studio is good tool to use. The strategy I deal with difficult measure are as follows.
- Break into small workable chuck
- first make it work, then make it right, finally make it fast
If you need to follow along, I have included dax and pbix at here.
I hope you feel this is helpful.
Good luck with your BI journey.
thanks
Wenlei