How to Retrieve and Use ArcGis data
I was tasked with a unique project: predicting home property damage using hail‑swath data so the company can better allocate funds and resources after major storms. Here are the key challenges I faced:
- The claims department had no prior experience working with hail data. They did have an ArcGIS Server I could use to access geospatial layers, but there was no existing python codebase or workflow to build on.
- I needed a reliable way to connect the geospatial hail data with claim records so I could create training data for modeling and also support future inference. This required figuring out how to geocode claim locations, perform spatial joins, and ensure the resulting dataset was accurate and repeatable.
I did some research online, but relevant examples were surprisingly limited. Fortunately, once I added ArcGIS as a keyword, the search results became much more useful — thank you, LLM‑powered Google search. It also surfaced details I hadn’t initially considered, like the need to convert ArcGIS Server outputs into GeoPandas‑friendly formats. There’s a lot of scattered information out there, and for any given problem, you still end up spending time connecting the dots yourself.
After a few days of trial and error, I finally worked through the data challenges — still the most time‑consuming part of a data scientist’s job. I’m writing this post so I can refer back to it later and hopefully make the path a little smoother for other data scientists facing similar issues.
Let us step through the process:
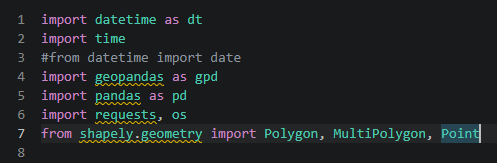
Import necessary libraries for handling time and geo data.
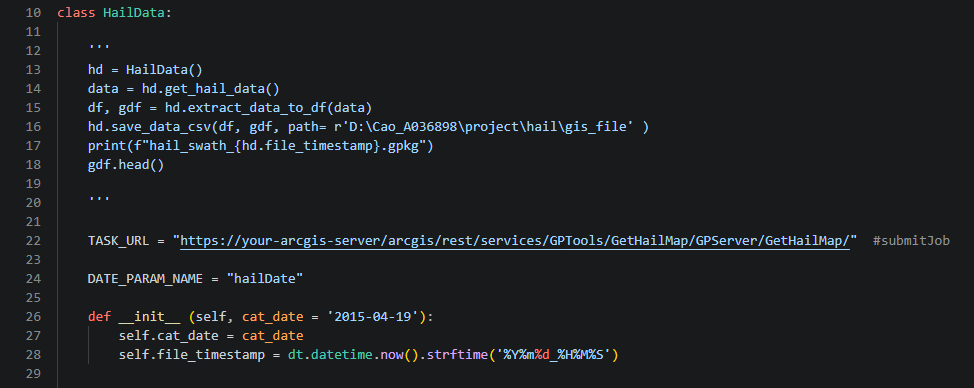
Create a class to encapsulate all related functions.
Rows 12–18 contain the docstring, which shows how the class is intended to be used.
Rows 22 and 24 define the class‑level variables — you’ll need to update these with your own ArcGIS Server address.
Rows 26–28 handle the class constructor.
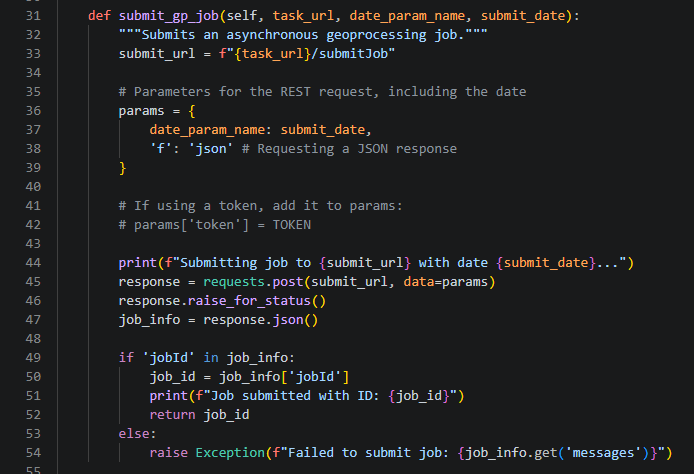
You can submit a job to the server, but keep in mind that it runs asynchronously. You’ll need to wait for the server to finish processing before you can retrieve the results.
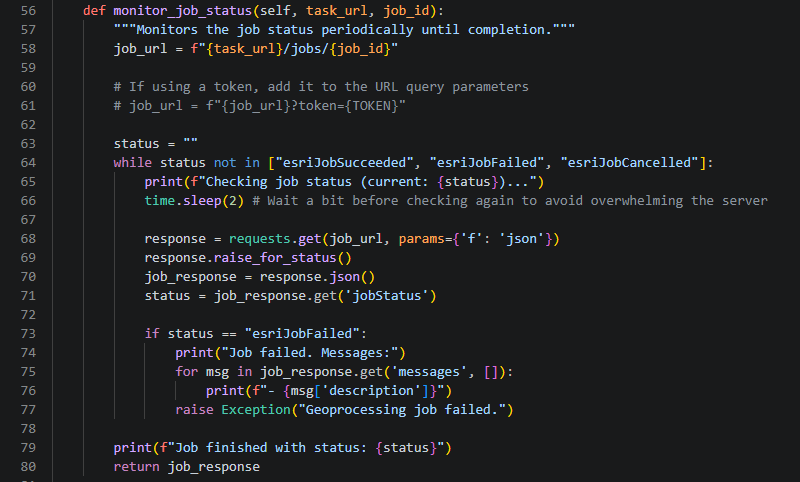
Use the jobId from the previous step to check the job status. Once the status changes to esriJobSucceeded, you can proceed to the next step.
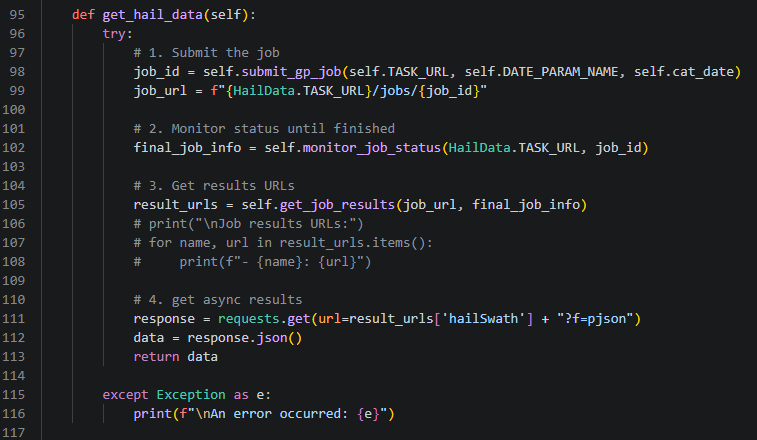
This is a wrapper function that orchestrates the previous steps and retrieves the hail data. Keep in mind that you can’t use the output directly yet — you’ll still need to convert it into a GeoPandas‑compatible format.
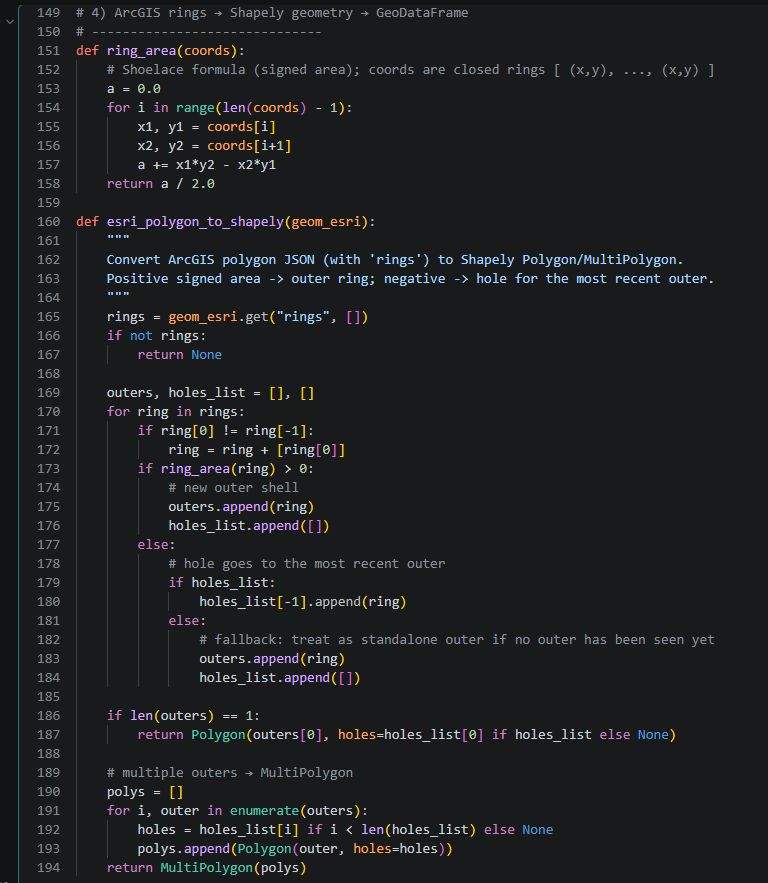 These two functions are helper functions to be used for converting data into GeoPandas format.
I make it module function so that I can use it in the class.
The function at row 119 converts the data into a GeoPandas‑compatible format. I also added a helper function at row 134 to save the data in WKT format, so I can easily resume my work even if I lose the original GeoPandas DataFrame.
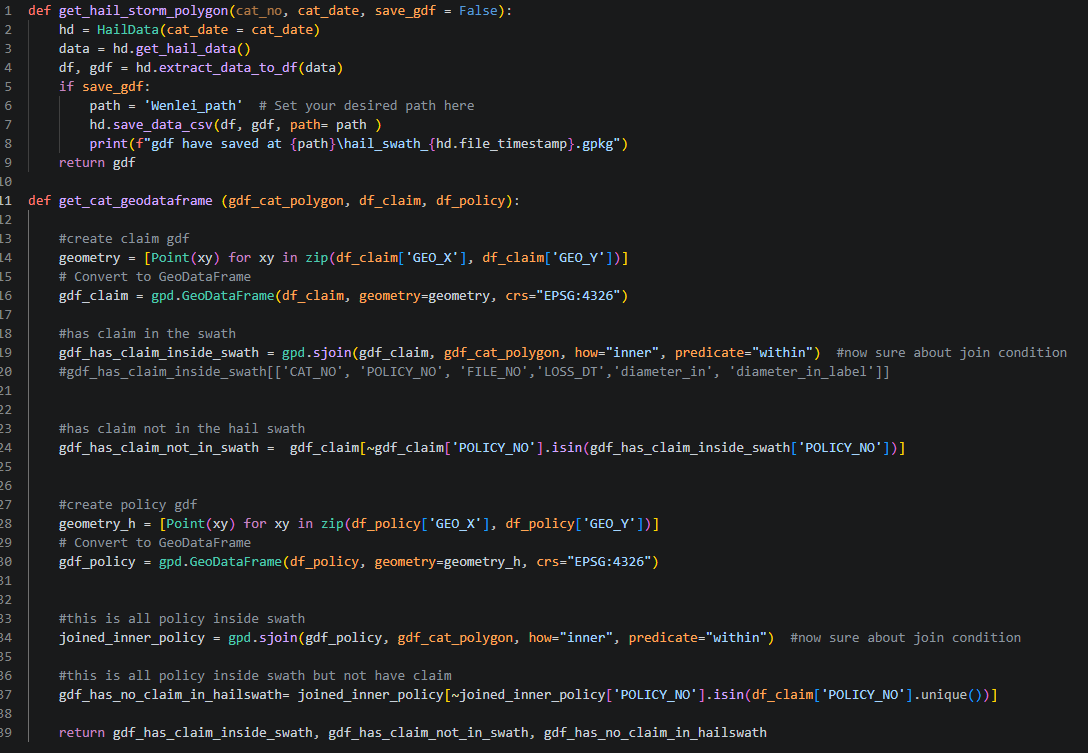
The function at row 1 combines all the previous steps to produce the final GeoPandas DataFrame — this is your hail‑weather dataset.
Now, how do you connect this weather data to your claim or policy data?
The function at row 11 takes the hail GeoPandas DataFrame along with your claim or policy DataFrame. Both DataFrames need to include X and Y coordinates so they can be converted into GeoPandas geometry using gpd.GeoDataFrame. Make sure they share the same EPSG value — by default, that’s 4326. Once aligned, you can use GeoPandas’ sjoin to determine whether a given claim or policy falls inside a hail‑swath polygon.
In my case, I output different scenario categories so I can use them as features for model training.
I hope this helps anyone facing similar challenges.
Thanks for following along,
Wenlei