Machine Learning Dynamic Feature Engineering and Optimization
Machine learning empower you to explore the deep relation between your data and result. In order to examine the deep relationship, you might need to do some feature engineering. The most common example, you can combine two features to get a more correlated new feature. Occasionally , you might need to generate feature dynamically while you examine the intrinsic relationship. When I say dynamically, I mean the feature value is based on certain parameter of its own. Let me give you an example.
If you have bought or sold stock, you will see people are playing indicators like moving average (MA), Relative Strength Index (RSI)… on stock applications. When the application shows you the indicator, it has done calculation behind scene with certain param, for example, RSI, using pervious 14 day data for calculate RSI value. You also may use RSI default value 30 (oversell) and 70 (overbuy) to guide you buy or sell. Since each stock has their own personality, Some are more volatile than others. Experienced traders usually do not use default number. They have their own best parameters. Can machine learning help us to find those secret number?
Here I just use stock data as an example, but similar situations can be found in other fields. The goal of this post is not to set a standard for how to do machine learning, but to see how to deal with this situation.
My goal is try to use current day close price predict next day close with indictor and indictor generated signal. Indictor and indictor generate signal value can be changed by indicator param. I need to select the best param so that I can get best machine learning score.
This is what I am going to do.
- Get the stock data, preprocess data
- Create functions that able to handle different type of indicator (I use two, but you can add more)
- Create class that inherits transformer. So we can use pipeline and Gridsearch
- Use pipeline and Gridsearch to compare to get the optimized param
1. Get the stock data, preprocess data
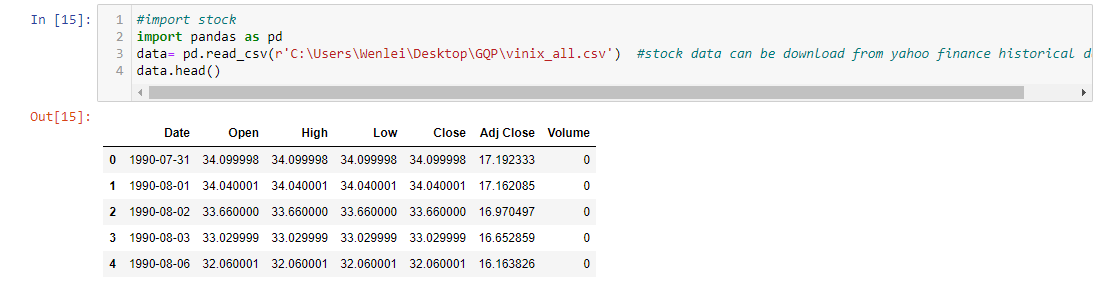
You can easily get stock historical data from yahoo finance. Search the stock code, in my case, I use VINIX, a mutual fund. Find historical data tab. You can download the csv file. I use Finta library to create indicator. The library has the name convention that will default use close for calculation. But I wish to use Adj Close column in the source data, since some stock will split, which make price plunge from one day to next day. So, I create the function to rename Adj Close to close, also get next day price for future use.

2. Create functions that able to handle different type of indicator
Stock indicator could have many categories. If you are interested, you can see the following post. From programming perspective, I tried two types, one is single indicator can direct buy and sell, the other needs two same type of indictors, one using fast period, whereas the other using slow period, buy and sell signals are from crossover/cross under of two.
https://www.visualcapitalist.com/12-types-technical-indicators-stocks/

For single indicator and example of passing param to create RSI value as well as RSI signal for buy and sell. Here I use default param value. But you can pass in different value, it will change RSI and RSI signal correspondingly.
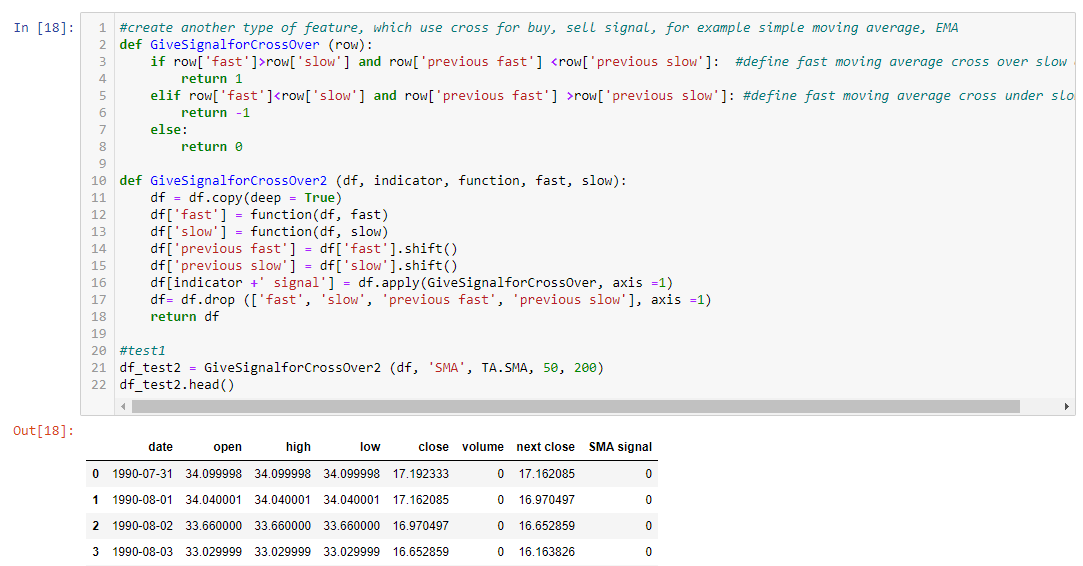
For cross type indicator, I create a separate function and example of output
3. Create class that inherits transformer. So we can use pipeline and Gridsearch

The purpose of creating class is to be able to use pipeline and Gridsearch to compare different indicator and hyperparam.
Here I passed in all param used in previous function, as well as function as param. In the transform function inside class, I use if to handle different type of indicator. In the final output, I only want to keep current day close price ,next close and indicator signal , so I remove all the other columns.
Example to use the class
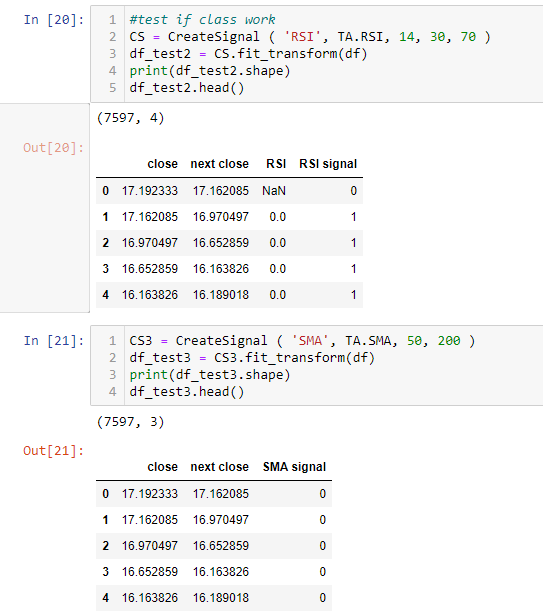
Instantiate class and pass in data frame, I can get signal from both type. Now, I am ready to use this in machine learning.
4. Use pipeline and Gridsearch to compare to get the optimized param
Please note: I did some data preparation before machine learning, include stratified train and test sample split, et al. it is between cell 22-27. Since it is not related with this topic. so I just skip those cells, but it is included in the notebook.
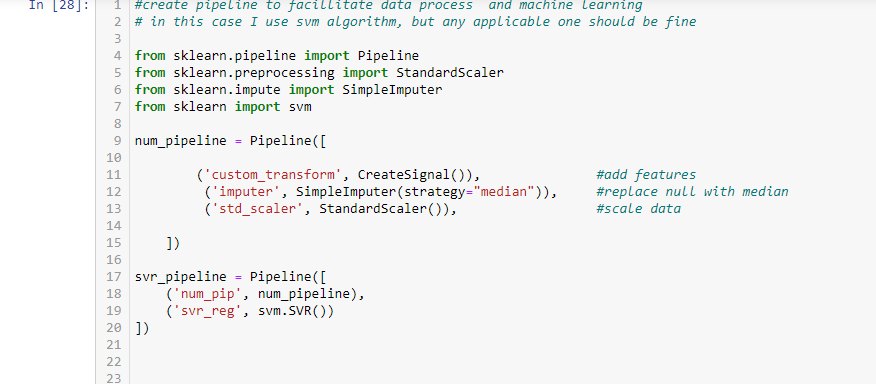
In my data, I don’t have categorical data, so I skip the categorical pipeline, if you do, add one hot encoding to a categorical pipeline. In the pipeline, I pass in the data, data is converted, then fill the null value with median, scale data to be ready for next step. The data is further passed to svm.SVR algorithm, here the machine learning is done to give you a score. you can show best param with score.
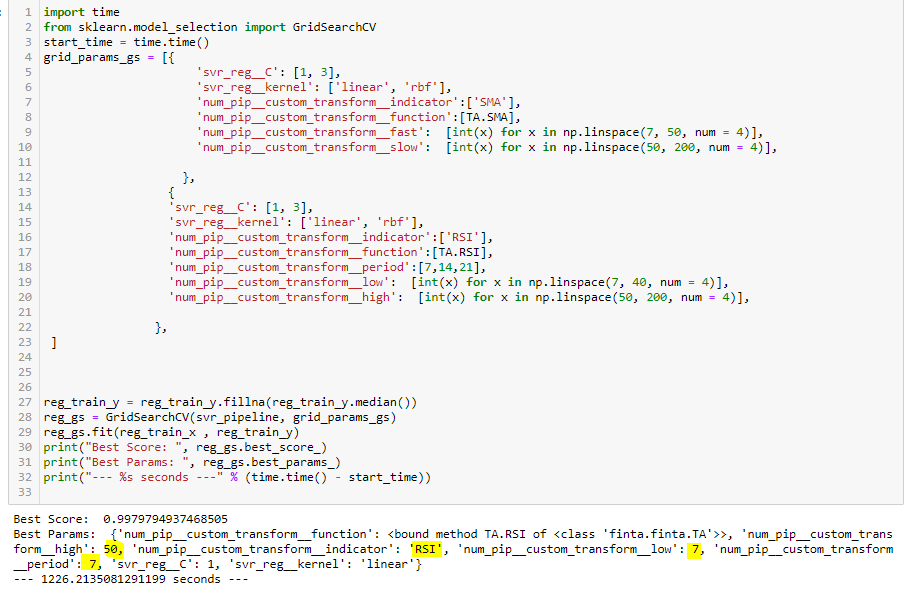
Here I compare RSI and SMA, with different param range, looks it gives me the best one is RSI and corresponding params to use. I can use that to test for next step.
This method take advantage of transformer, pipeline, gridsearch, which can free you from tedious manual testing. I have not done thorough tuning, but this should give you a good idea how this worked from end to end.
I hope you feel useful.
Always keep safe in this crazy time.
The source file and notebook can be download here.
Thanks
Wenlei