Many to Many relationship in Microsoft Tabular model
One of features that Multi-dimension cube has whereas Tabular model doesn’t is that Tabular model cannot handle many to many relationship. This has been resolved in the 2016 release by Bi-directional cross filtering by setting it in the relationship window. However, not all companies can keep pace with the latest release. In fact, our company just start to update from SQL Server 2012 to 2014 this year. Our analysis server is still using 2012 SP2. But that does not mean we cannot deal with many to many relationship in tabular model. Actually, there are workaround by using customized DAX measure. And if you understand the context concept and know some basic of DAX programming, it is actually not that difficult.
I read quite a few articles online. Either they don’t have detail steps or the example is too complex to follow. I try to use a simple example and give detail steps as to how to implement it.
Here I use dummy student class dataset which I had a post before to use for an example. see download link below.
This dataset is like this:
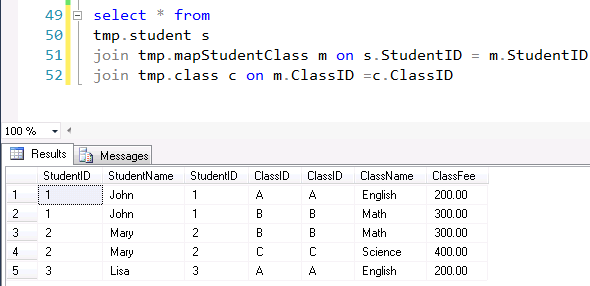
So, one student can take multiple classes and one class could have multiple students. Our goal is able to calculate correctly from one side to the other. Such as how much each student paid for class? How many students in each class? I included classfee in class table, we can see if it works natively. If not, how we fix it. The presentation layer, we use PowerBI desktop, we can show result in table and graph. We can also create custom DAX measure there if we need to fix the problem.
Steps
- Create student, class, mapstudentclass table in SQL Server database. download code here
-
In visual studio, Create tabular model project, import data
a. From menu model, import data source, choose SQL Server database, following the instruction, import data from the table you created in step 1
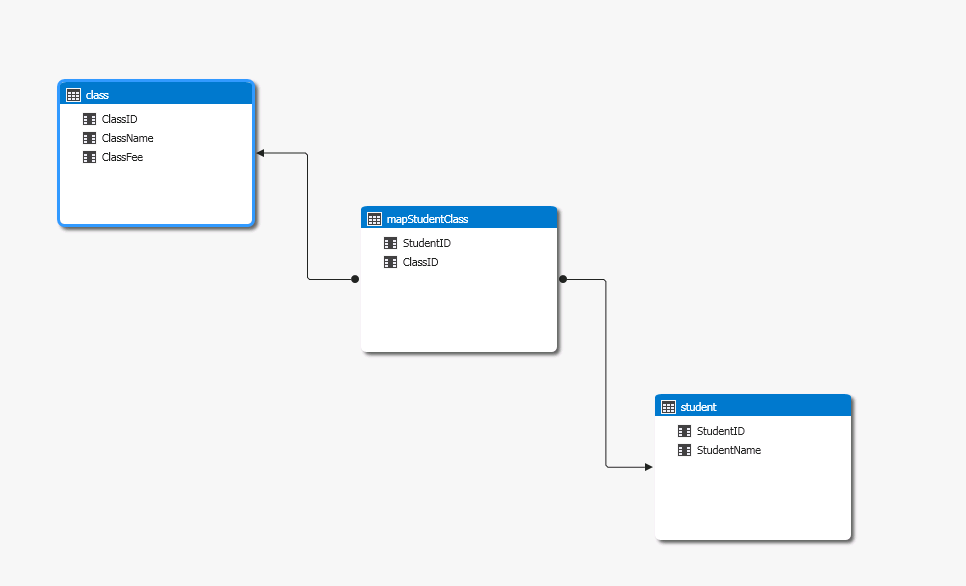
b. Now, you will see model structure like this if you click digram view of tabular model project. You can see the bridge table mapstudentclass is in the middle
- Save the project, and deploy the project to a tabular model server.
- Open PowerBI desktop, click get data, choose SQL Server analysis service database, provide server name and select the tabular model you just deployed.
-
You will see table is imported in powerBI

- Now let us see what if we choose studentname and classfee (choose like above figure). I use visualization of table and bar chart

This is what we are supposed to get
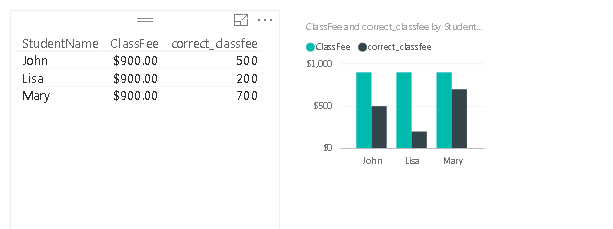
Clearly the calculation in tabular model is not correct. How to fix that? We can create a new measure in PowerBI desktop and define the new measure as the follows

Now let us bring in this new measure side by side with the ClassFee

The number matched :)
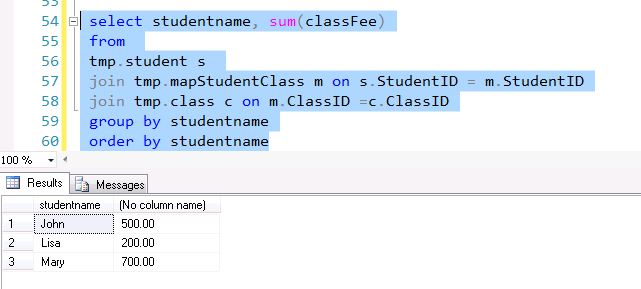
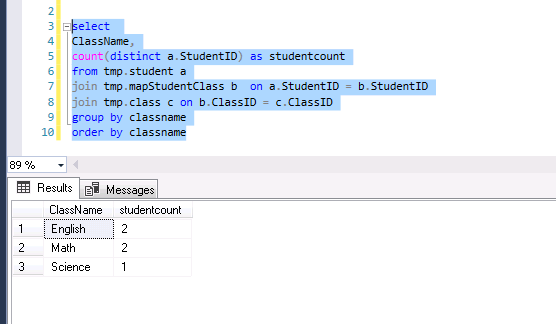
What if we want to get how many student each class. That is reverse process from the previous one. Let us see what we are supposed to see in SQL.
if we create a measure like this
studentcount = distinctcount(student[studentid])
you will see this

you would have to create measure like the follows
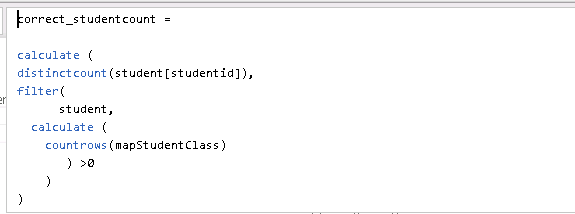
this is what we expected

So why Tabular model behaves like this? It is because in Tabular model, there are two context, row context and filter context. Row context works row by row. When you create a calculated column, column C = columnA + columnB. At each row, it will find column A and columnB and add together. Some DAX function like addcolumns, sumx et al works this way.
Filter context is set of filter already applied on data before DAX start to calculate measure. Somewhat similar to where clause in SQL.
In the case of classfee calculation, each student will have classfee. We selectstudentname with classfee. Each studentname is the filter context.
In DAX, you can change filter context via calculate and calculatable function. This is helpful when you want the result in different context level, such us child/parent ratio calculation. For example in the following link, I show how to sum at product and product category level and then calculate ratio https://wenleicao.github.io/Compare_MDX_to_DAX_programming_pattern/
Filter context can propagate along one to Many direction. If you filter on the one side, the many side is also filtered. For example, if the fact table has membersk link to dimmember table, you can filter on dimemember, the fact table also filtered, which mean calculation only happen to the fact record with membersk filtered in.
We model the Many to Many relationship with bridge table. It is composed of two one to many relationship. Table-bridge table- Table is one-Many-one relation.
With these knowledge in hand, let us look at the correct_classFee measure again
correct_classfee =
calculate (
sum(class[ClassFee]),
filter(
class,
calculate (
countrows(mapStudentClass)
) >0
)
)
If outside filter context is John (in powerBI, we drag in studentname in table with measure, each student will be aggregated by , therefore became filter context), this will propagate to mapsudentclass table (one to many), there are two record in this filter context ie,
StudentID classID
1 A
1 B
The following will end up with class A and B row, because studentID 1 is in filter context, the sum of classFee will give correct number (class A and B fee).
filter(
class,
calculate (
countrows(mapStudentClass)
) >0
)
The same apply to Mary and Lisa. Therefore it ends up with correct number.
Hope my explanation make sense to you.
You can download DAX code here
You can download PowerBI file here
thank you.
Wenlei