Address the Many to Many relationship in Multi-dimensional SSAS cube
In relational database, there are a few relationships between tables, One to One, Many to one, Many to Many. Some typical real life examples for Many to many relationship are student vs class, bank customer vs bank account, order number vs product. To model many to many relationship, we typically use a bridge table, or a mapping table, to connect the two tables. As to why we need to use the bridge table, this youtube explain very well.
https://www.youtube.com/watch?v=JgW43deaex8
When we build multi-dimensional cube on top of the data warehouse, often time, we cannot avoid many to many relationship. I tried to model this at the cube level, but I failed to find step by step tutorial online. I decide to do some digging on this and start building a proof of concept.
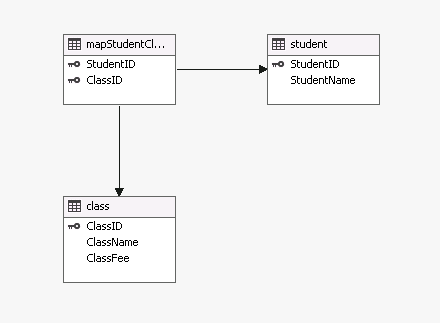
Here I use student class as an example. Each student could attend multiple classes, at the same time, each class could have multiple students. Besides that, we want to do some calculation at data warehouse level, and see if we can also accomplish that at the cube level. Let us first create tables and define the relationship between them with T SQL (source code can be downloaded, see link at the end).
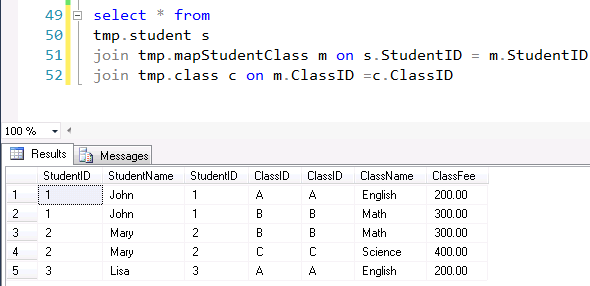
I inserted some fake data, so that we have a source to build cube from. Here is what I get
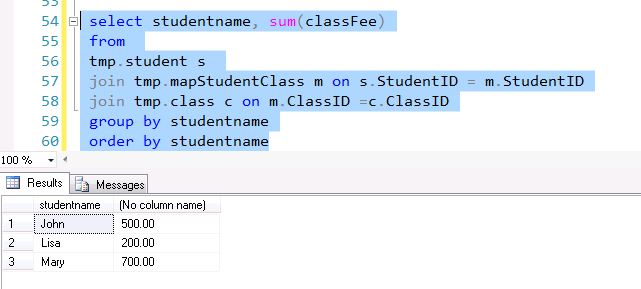
Let us do a calculation across the bridge, here I calculate the class fee based on student name.
Now, we have this small many to many sample, let us see if we can make the calculation work at multi-dimension cube
Create a data source, connect to the server and database where your table created
Next, create a data source view
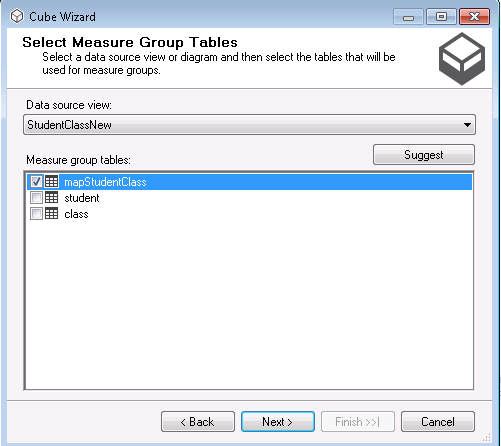
Right click the cube and create a new cube, cube wizard appear, then choose the data source view just created and choose the mapping table as the measure group
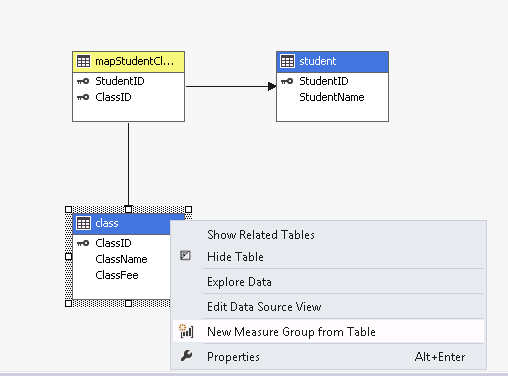
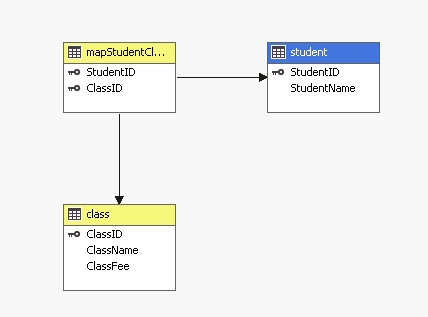
Click next, it will automatically list student and class table as dimension table. in the class table, we have class fee column, which we want to use for calculation, so we right click class table, and choose “new measure group from table”. This will convert the class table as fact table in yellow shade.
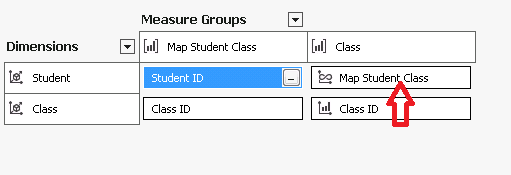
If you look at the dimension usage of this tiny cube, you will notice the relationship between student and class is automatically set as many to many relation
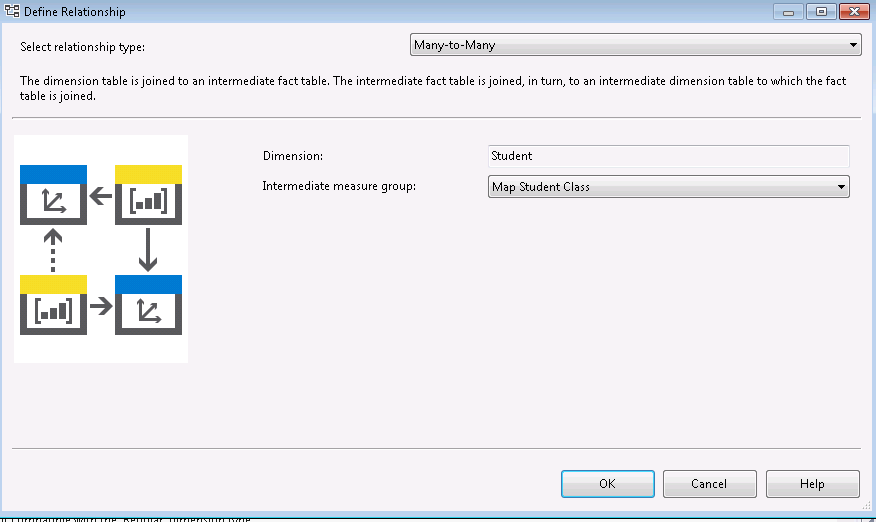
Click the many to many relation, you can see the detail. This two table is connected by mapping table.
Now we build the cube, deploy and process the data to the cube.
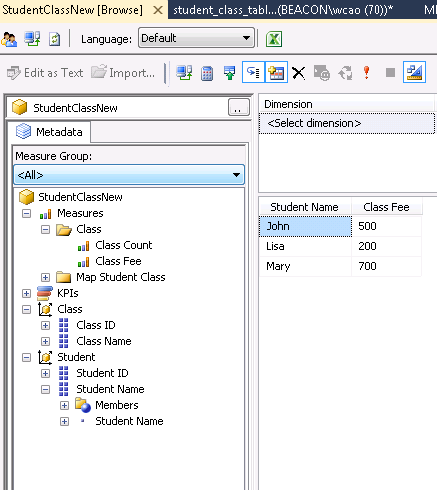
Check the data through cube browser.
The number matches what we did with the SQL query previously. After this small experiment, we should be able to implement some more complicate logic. Good luck.

