Shap Value for Single Record in Model Prediction
Feature importance helps us understand what features play more importance roles in a given model. After that, you can do feature selection, or you can use results to cross check with your business domain knowledge to validate the model.
In the past, the majority of analyses focus on the feature importance at the model level. At record level, however, it is difficult to describe what causes the model to make the particular prediction to a single record. One can make a guess, but a precise contribution of each feature still lacks. However, in the business world, stakeholders will be eager to know what features drive the prediction. Let us say, our model predicts a customer will cancel his insurance policy. If the model also provides what actual cause is, this will help the customer service team to handle customers accordingly. Overall, the explanability is more important in the business world.
There is a python shap package which can help us to achieve this goal. I read quite a few blogs and found most of them are showing various fancy charts that the package is capable of. But few focus on the single instance feature importance.
Let us see how we use iris dataset to unveil the mystery of single record feature importance and see if we can make a function to explain the prediction for a record so that we can make our life easier next time.
First, let us set up an experiment. We started with importing packages and data from iris, creating a simple random forest classifier. Then we take a look at how SHAP explains the results.
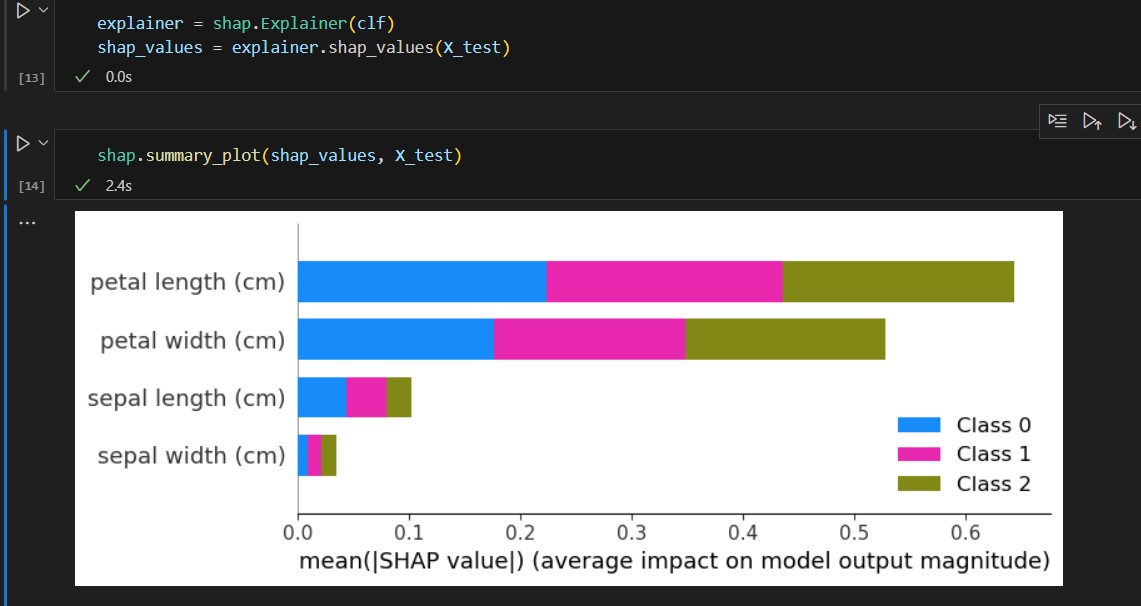
We instantiate an explainer and use that to get SHAP values. The summary_plot will tell us, among all 4 features, petal length and petal width plays a more important role compared with sepal length and sepal width.
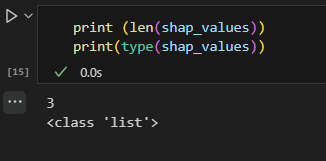
Let us take a look, what shap_values is. You can see it is a list with 3 elements.
If we dive in the shap_value to understand its structure. We can see SHAP_value is actually a nested array.
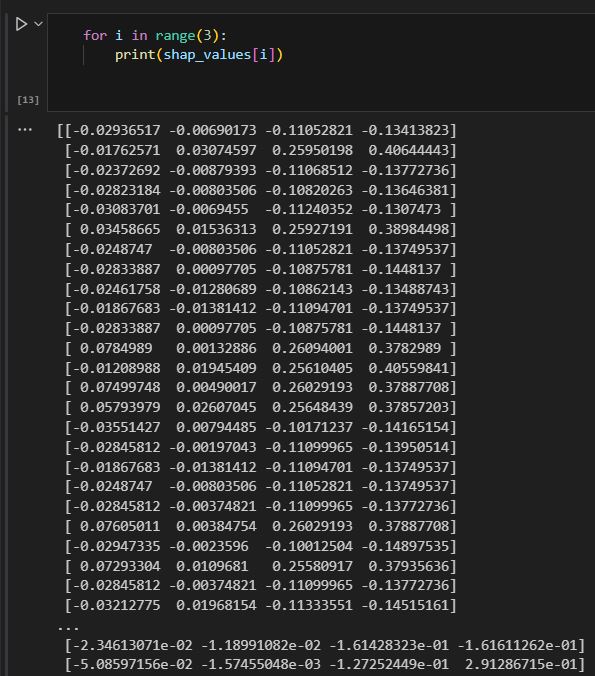
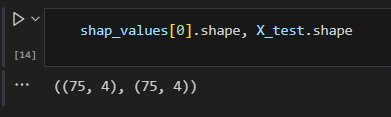
Each array contains the same dimension as our input dataset. Indicating that for each class (3 for iris data) SHAP has one value set for it.
Before we show one record feature importance chart, we see how data looks like for a given record.
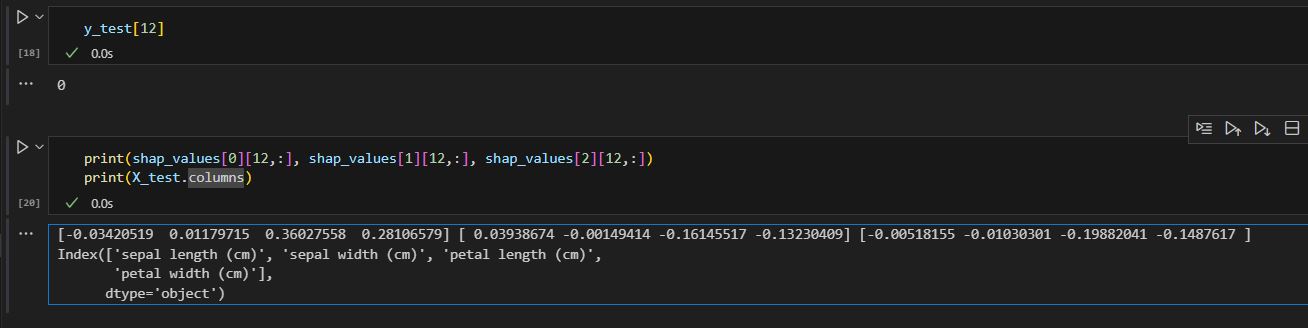
We know this record is classified as 0 by model (see cell 18). We also print out its SHAP value for each class and corresponding column name. You can see the first list gives larger numbers except sepal length(cm) is negative. Maybe that is why the prediction is 0 (first element)?
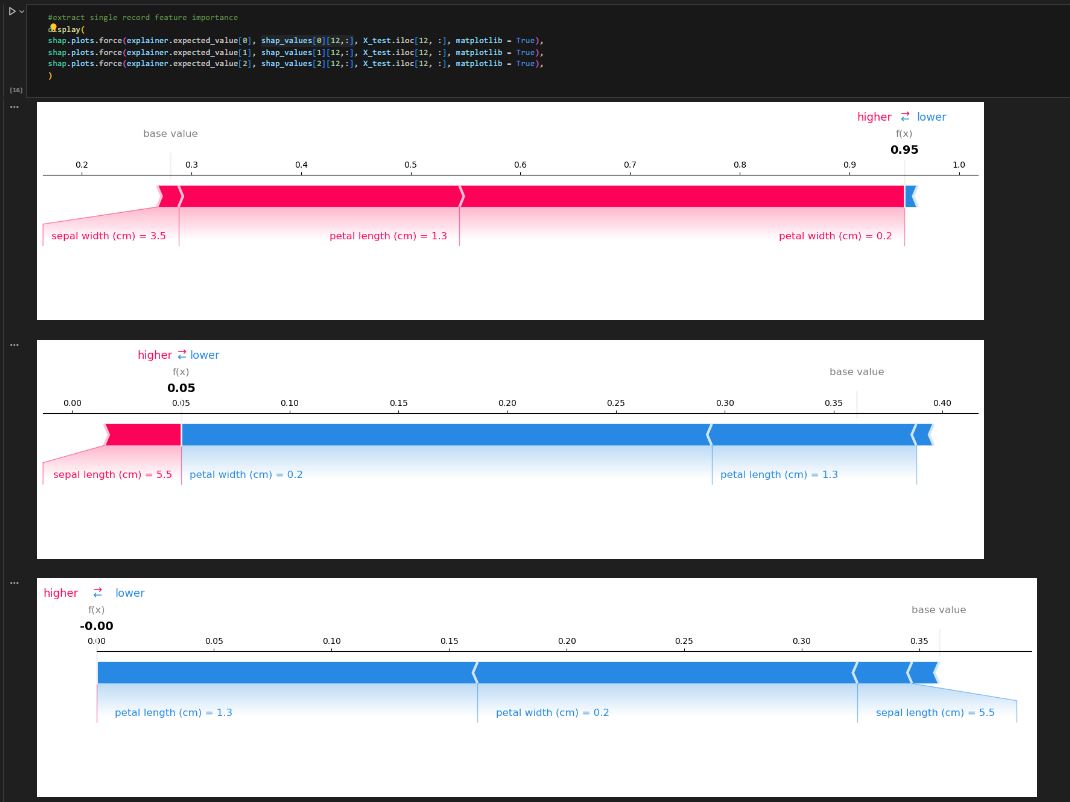
When we observed the force chart for this record (below), it proved our assumption. Only difference, SHAP puts negative value to the right. But you can see the number of positive values corresponds to the number of red, and the number of negative values corresponds to the number of blue. The final prediction is determined by which list produces the largest number. In this case, the 0 class produces the value 0.95. therefore, it is classified as 0.
Now that we understand the data structure of shap_values and how it makes decisions. We can see how we extract the most important features for a given record.
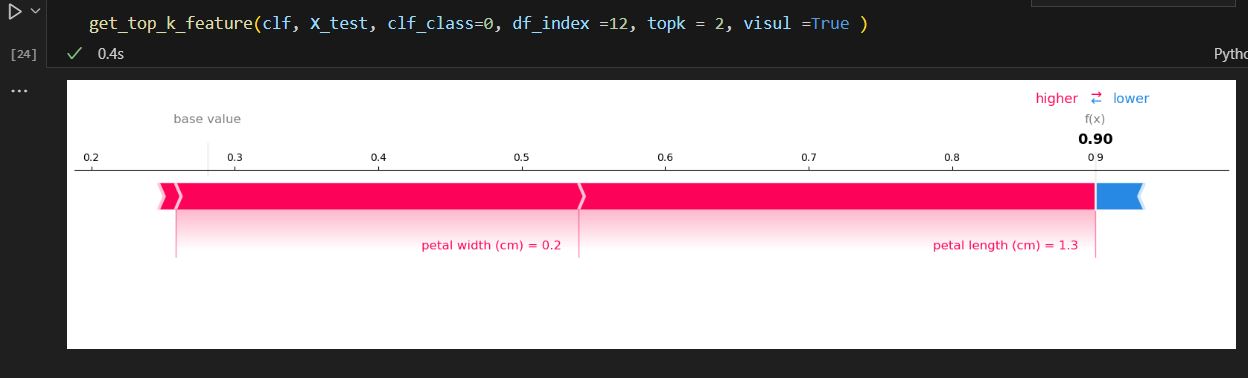
This is our target: we want to extract class 0, number 12 record, top 2 import features.
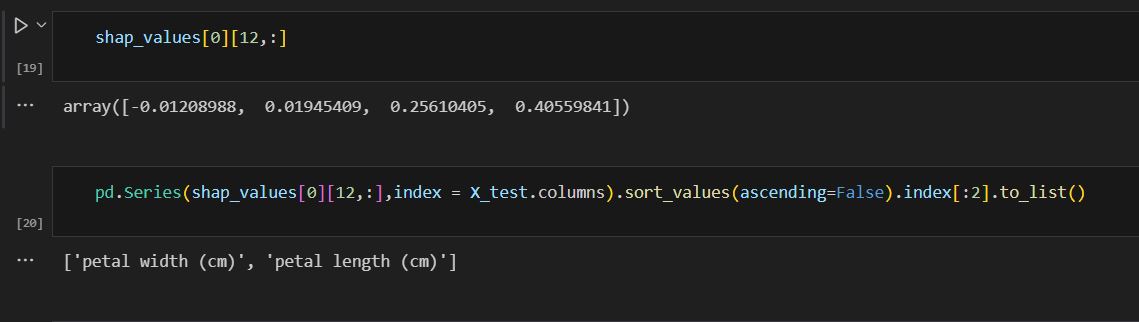
Cell 19, give us the class 0 and number 12 record SHAP value.
Cell 20, we can convert it to pandas Series and give it column name, then sort value, get the first 2 feature names as it is showing here.
It will be cumbersome to do this exercise every time we have a new model. A function will be helpful.
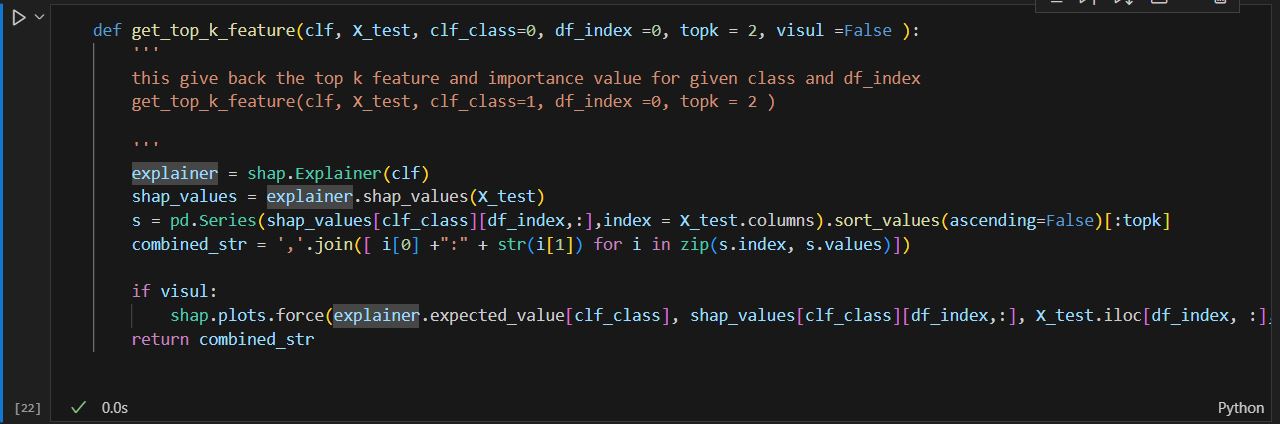
So, there I did slight modification to the previous cell, instead of only getting the feature name, I also included the feature value for that class. So that, people can see what the feature weight is. Also, if the user wants to see the force chart, it is optional.
Let us do a test run, if we use the same record we run previously, we can see it gave us the same result as before.
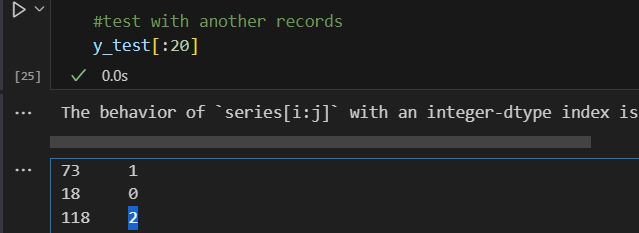
let us see if we can use it to check other records. We list the first 20 records and pick the sequence 3 one (highlighted, notice I am not using the index of y_test, since it is shuffled in the train test split). This record is classified as 2.
Let us first get all force charts for 3 categories.
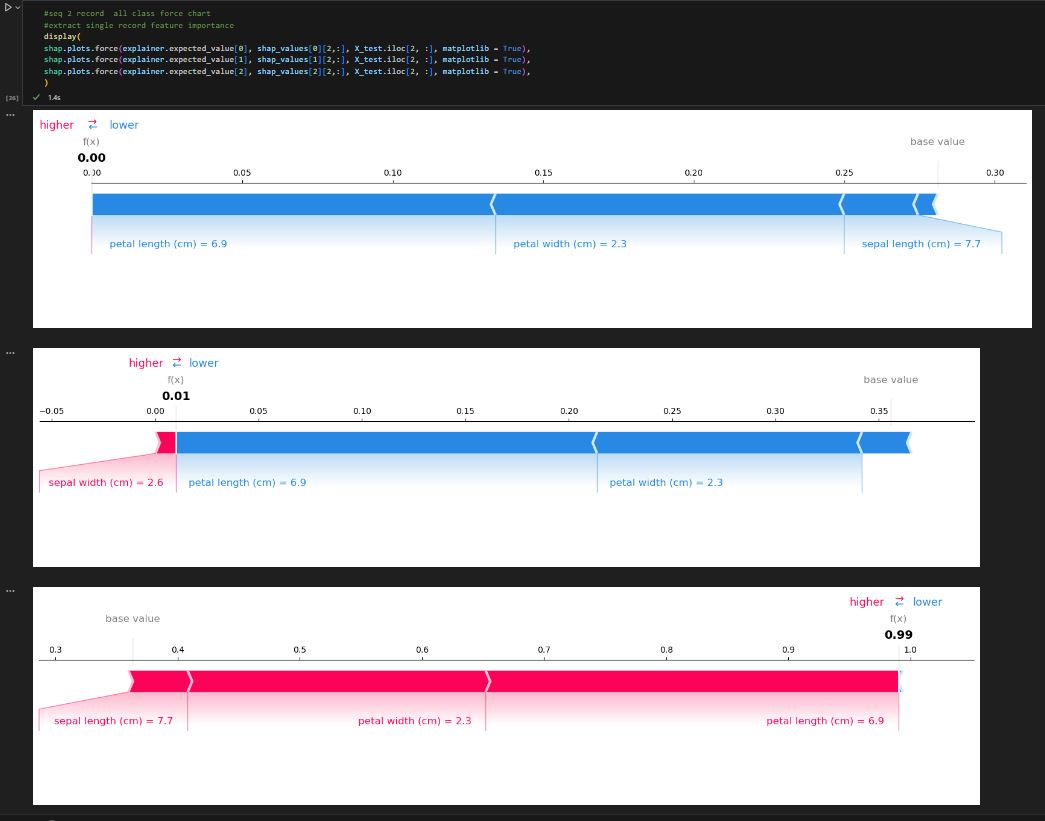
We passed in the parameter for this record, index =2, category is 2
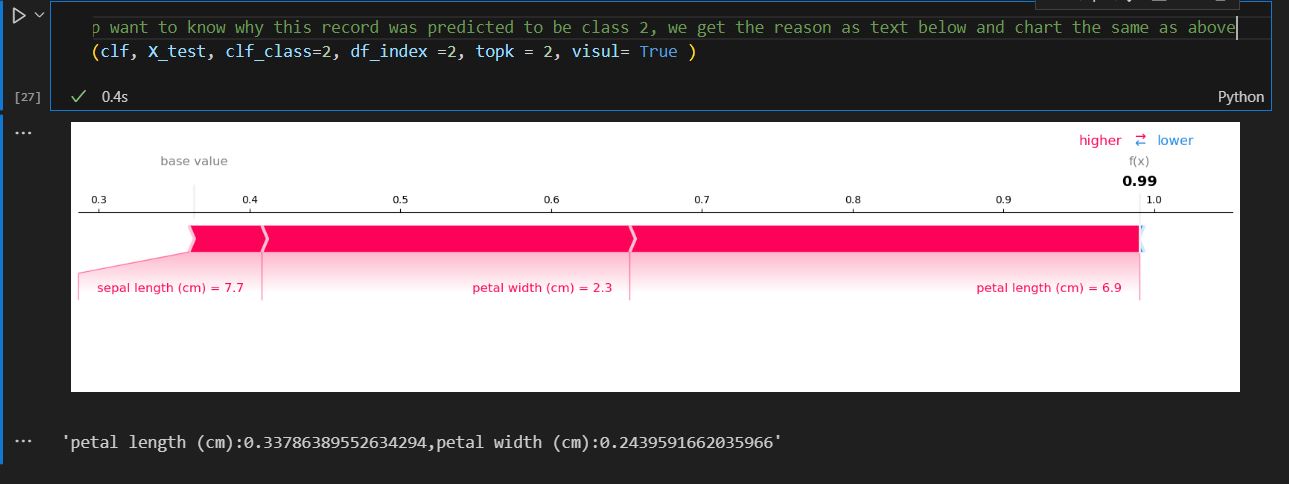
We can see it indeed show the same result as we expected.
thanks for following along. I hope this help you understand the shap_value a bit better.
Attached is the notebook which used in this post.
Wenlei