Solve DAX Cross Group Calculation in Power BI
Accurate dashboard visual relys on the underlying correct data. I like to first get data right in the table, then build visual on top of that.
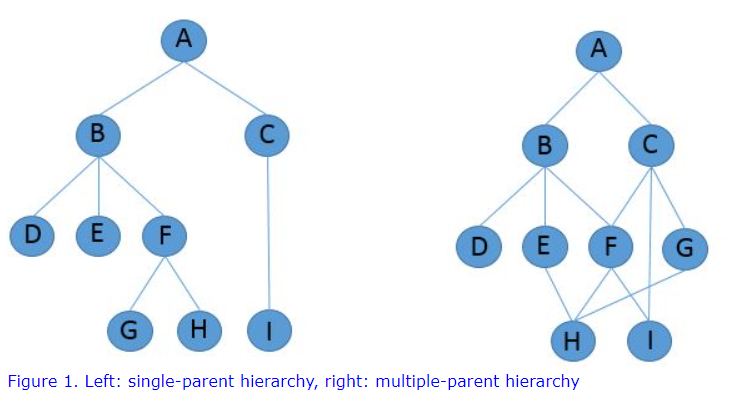
In the matrix power BI report, you will see multiple layers of hierarchy columns and your measures are sliced and diced by the columns. Most times, we come across single parent hierarchy, like the left diagram. But occasionally you will see multi parent hierarchy (right diagram). For example, H has 3 parents.
A real example is as follows.
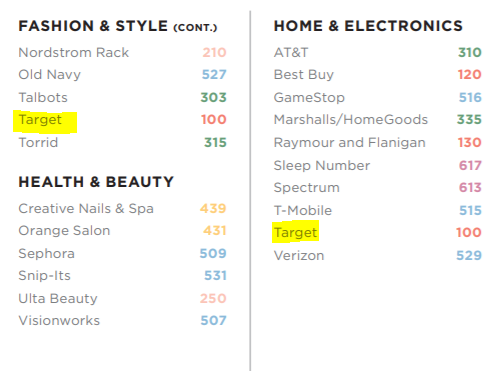
This is a mall directory I visited the other day. They classify Target store in different categories because it sells both products. In this case, Target has two parents. The real challenge for multi-parent hierarchy is when you do some analytics, you don’t want to double count it. But sometimes, requirements might want to show aggregate numbers across the group.
Let me give you an example. We set up a fake data source like so.
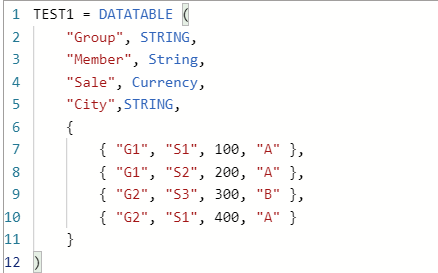
This contains two groups and 3 members. Notice that S1 belongs to both G1 and G2.
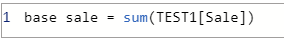
We have the dummy data now. Just create a base sale measure.
Let us create a matrix table in power BI and bring group and member in row, then bring in base sale measure in value. You will see the following.
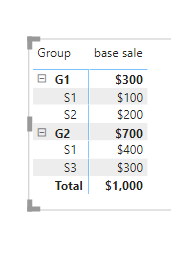
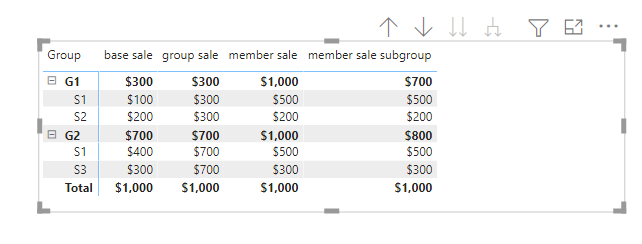
This looks all correct to me. Now let us say we want to have a group sum

Here I use RemoveFilters function to remove member context filter. So it only left group context filter.
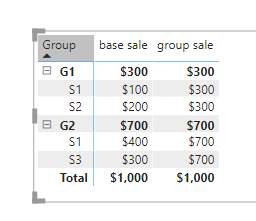
This will give each row the value of group sum. Notice the sum for each group G1 and G2. You can use group sum to do ratio and so on. You think it is all perfect. Well, not yet :). Because S1 is in both Groups, Your boss really wants to see the sum for S1 (cross two group sum) showing in both Groups, so he don’t need to calculate manually, but they don’t want you to double count S1 in Grand total. Somehow, I think this is odd. But your customer could have all kinds of requests. Believe me.

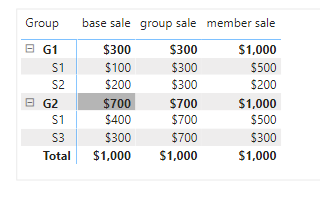
Here I use the allexcept function to remove all filters, only left member filter. So measure is not affected by group filter context. You can see member level sum is corret (S1= 100 +400). But at the group level, since we don’t have group filters any more. It basically show total =1000.
How do we fix that?
If we have to do it manually, we will add each row up in each group. This gives us the hint that we might want to use SumX to fix this issue row by row.
Let us first give a try
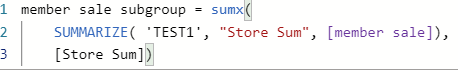
In this case, I first using summarize to create a virtual table, then sum it row by row.
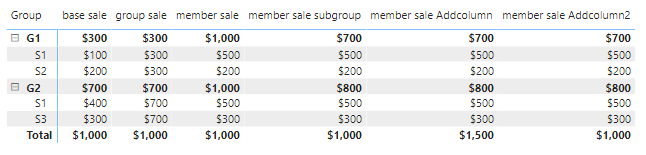
As you can see, it met the requirement, the S1 total has been showing in both groups. And subtotal is correct for both G1 and G2. The grand total is not double counted.
However, People have been questioning the summarize function, complaining it gives weird results. For that, Alberto has a specific blog for using summarize. This is an in-depth explanation.
https://www.sqlbi.com/articles/all-the-secrets-of-summarize/
The following discussion is a good one for understanding in general
https://forum.enterprisedna.co/t/understand-the-difference-between-summarize-and-addcolumns/9018/10
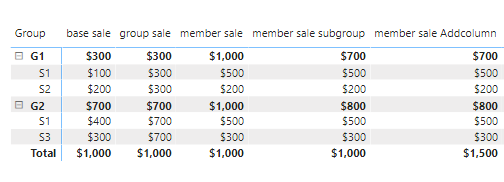
To avoid potential issues, can we replace it with Addcolumns to avoid unexpected issues?
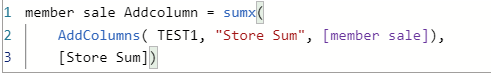
Using this measure, everything is correct, except the Grand total. What is going on?
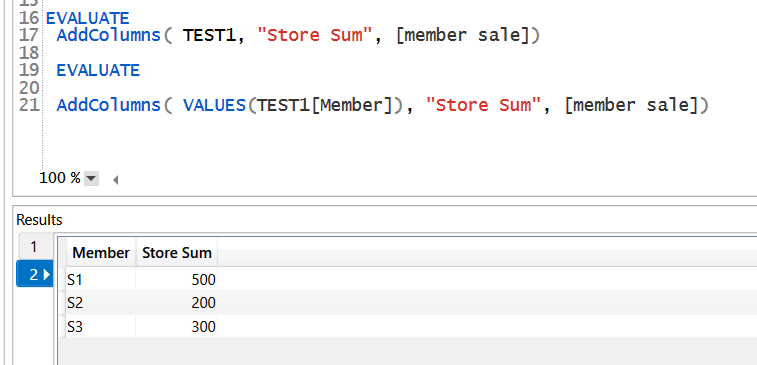
We need to do a bit of trouble-shooting. I connect the dax studio with the pbix file. Use evaluate statement to see what AddColumns( TEST1, “Store Sum”, [member sale]) yield (line16, 17). I can see the following result.
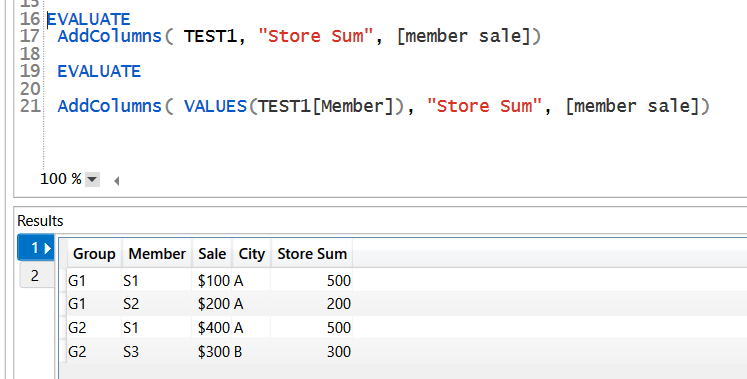
That means it has 4 combinations of group and member, in this case, if we use sumx, it will sum up the 4 rows and give us 1500. That is why it has an incorrect number. Then how do we fix this?
The reason we double count is because we have group in combination. If we remove group, only left member, will that fix the issue? I run line 19-21, which give us the second result.
This is correct. Let us create a modified version.
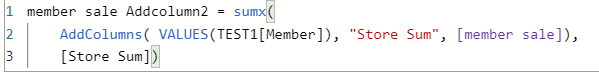
Looks like our second version fixed the issue. Also it avoids summarize function in calculation.
Let us check if the outside filter will break this.
We can use city as a slicer, which works as an outside filter. All stores are in City A, except S3 in the City B.
Let us add City as slicer and only choose city A.
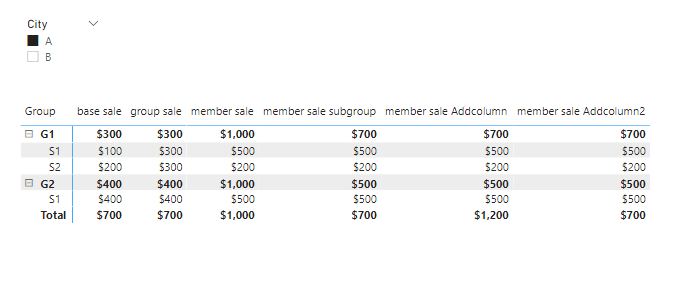
Looks like the measure works fine.
This example shows multiple parent hierarchies data could pose certain challenges to the aggregation process. This example demonstrates the filter context change, using row context for aggregation. And showed how I trouble shooting some of the problems. With the versatile DAX language, I finally cracked it. That is how power BI becomes more powerful than other dashboard tools.
I hope you feel useful. The PBix can be downloaded here.
Take care.
Wenlei