Streamlit for reporting
I recently started exploring Streamlit because our team has been using it to build chatbot interfaces. Compared with other dashboard frameworks like Dash, Streamlit makes it even easier for Python developers to create clean, interactive web UIs—without needing any JavaScript knowledge.
One of the most helpful and compelling ways to get started is by following Streamlit’s sample project on Uber pickups in NYC. It showcases how naturally Streamlit integrates Python’s data‑processing power in pandas with built‑in visualization features like st.map, which makes plotting geolocation data incredibly simple.
I was genuinely impressed by how much functionality you can achieve with just a few lines of code. Streamlit lowers the barrier to building data apps, and it feels like a natural extension of the Python workflow I already use every day.
With experience in both business intelligence and data science, I was curious to see how Streamlit handles some of the practical challenges that come up in real workflows. One common requirement from business users is the ability to click on certain fields—usually IDs or reference numbers—to quickly jump back to the original system or another data source for comparison.
If my data already lives in a pandas DataFrame, it seems natural to expect that Streamlit would support clickable content out of the box. But after some exploration, I found:
-
There’s no official Streamlit feature for clickable cells in a DataFrame.
-
Some community members suggest using AgGrid, but in my case it didn’t work as expected.
-
The internet is full of creative hacks, but most of them felt too fragile or overly complicated.
I wanted a clean, reliable solution. Eventually, I found an approach online that wasn’t fully functional as written, but the underlying idea was solid. After adjusting the regex pattern and making a few tweaks, I was able to get it working smoothly in my own app.
Here is the original reference link for the idea (credit to the author): <Clickable hyperlinks in dataframes - Using Streamlit - Streamlit>
I copied the code as this
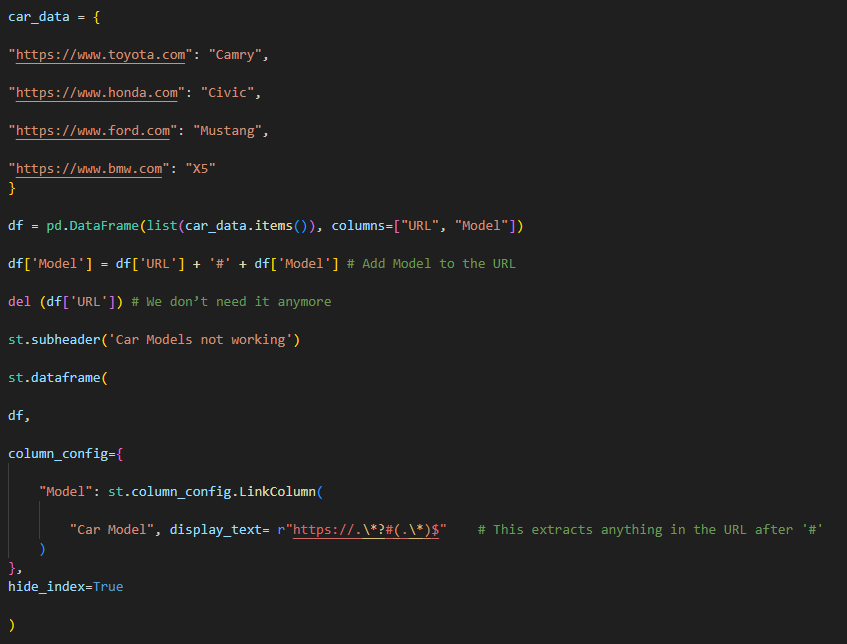
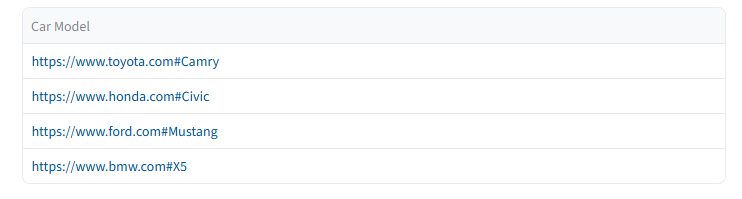
The result is like this, it did not show hyperlink correctly.
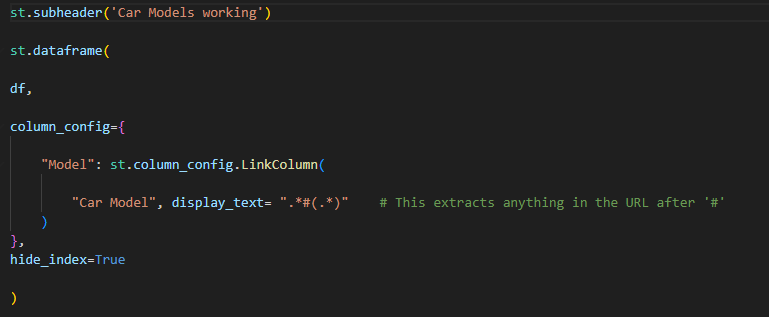
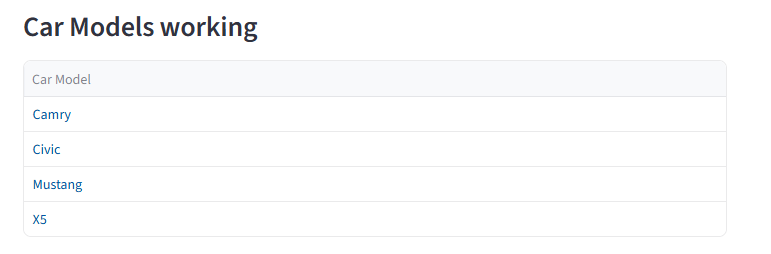
I only change the regex pattern part, this works.
Another feature I often rely on in business intelligence tools is the ability to drill up and drill down. Business users frequently want to slice and dice the data so they can move seamlessly between detail‑level insights (“the trees”) and high‑level summaries (“the forest”). A good drill hierarchy lets them explore multiple levels—such as Year → Month → Day or Country → State → City—without losing context.
Streamlit does offer a “Drill Up / Drill Down” example in its documentation, but it’s not quite the same as the multi‑level drill functionality found in traditional reporting software. The example essentially adds an “All” option, which is helpful, but it doesn’t support true hierarchical navigation across multiple granularities.
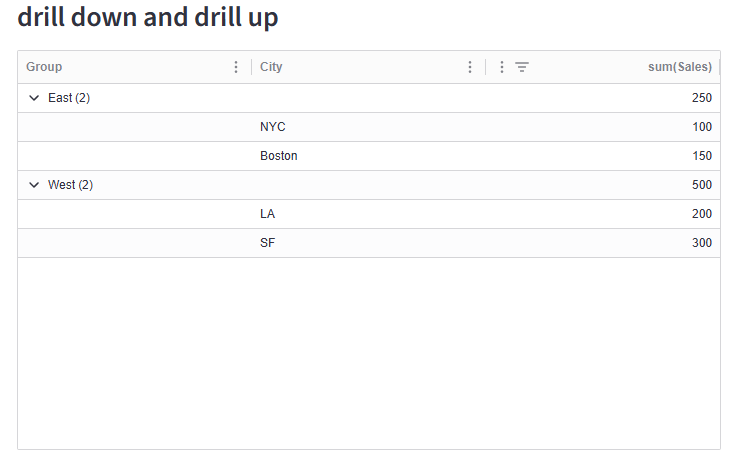
I found one of Streamlit extension, st_aggrid, do a decent job on this. One example online is to aggrgate regional sale.
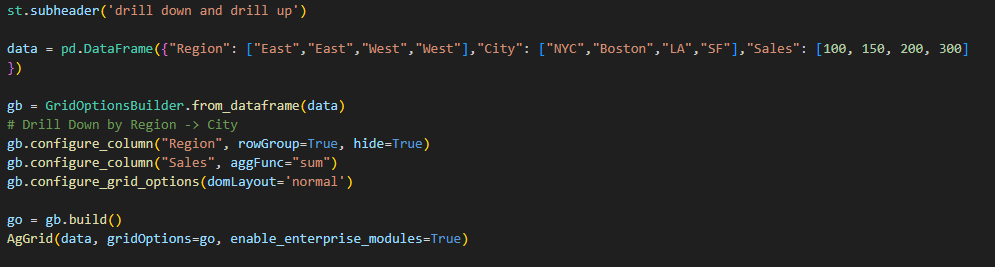
you can see that the output of region can be expand.
This is one level drill down, can I add one more to form a navigation path?
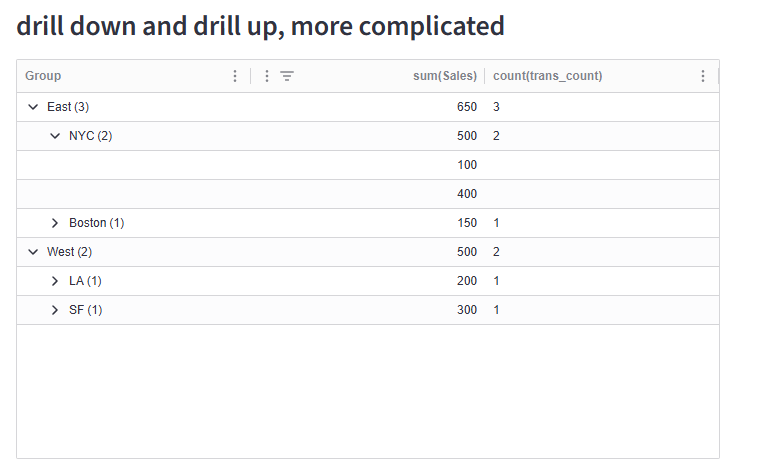
I add another level on city.
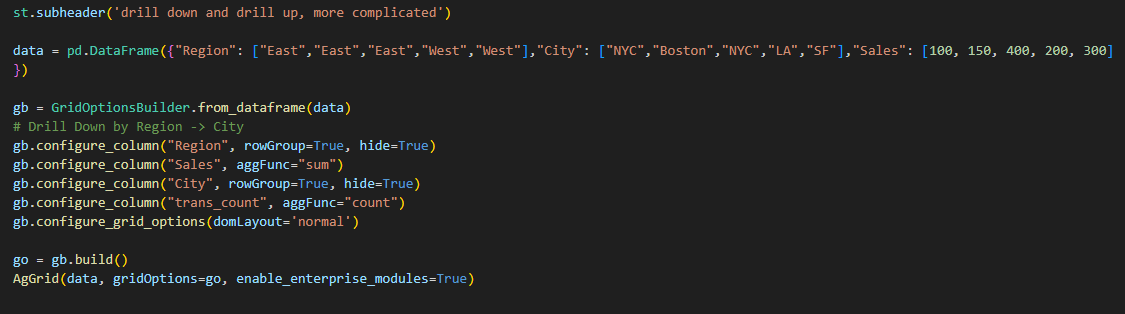
You can see that city also show drill down.
In summary, Streamlit provides an incredibly easy interface for quickly prototyping ideas and showcasing results. It may be a bit nitpicky to expect it to match every feature of full‑scale BI or commercial reporting tools, but with the right extensions—or a bit of custom code—it becomes surprisingly powerful. With some creativity, Streamlit can deliver results that are comparable to many commercial solutions while remaining lightweight, flexible, and developer‑friendly.
Thanks for visting my blog. Here you can find all code related with this post.
Wenlei