Troubleshoot DAX issue quickly with SQL Server Profiler and beyond
Assuming you are a developer of big organization, your Power BI dashboards were all built from one popular Tabular model.
One day, your boss calls you in his office and points to a Power BI dashboard saying this number does not make sense. Can you take a look and tell me why? I will meet big boss in one hour. Can you give me some insights by then?
Guess what, you are not sure if you will be able to figure that out within 1 hour. But you need to understand what is going on first.
What are you going to do?
(Please Note: This post is intend how to get thing rolling quicker, not about how to resolve a particular issue.)
Everybody does things differently. There are no so-called correct ways to do it. As long as you can solve the issue, it is a right way. The following is usually what I would do.
Basically, most of visuals in power BI dashboard are using the attribute in dimension table to slice and dice the measure built on the fact table. Any visual no matter it is gauge, slicer, scatter/line/column, map chart can be converted to table by click the table on the visual panel. After you do that, you can easily found what attributes and measure being used in this visual by checking Field panel.
But in order to understand why the number is off in Dashboard, you need to know How DAX ran under the hood.
Now depending on if you have complicated filters on the dashboard, if dashboard is simple and filters are limited. You probably can replicated the process with the tabular model browser.
First connect the SSAS server interested, right click the tabular model database and choose browse. You will find the window like the following image. Then choose language DAX instead of default MDX.
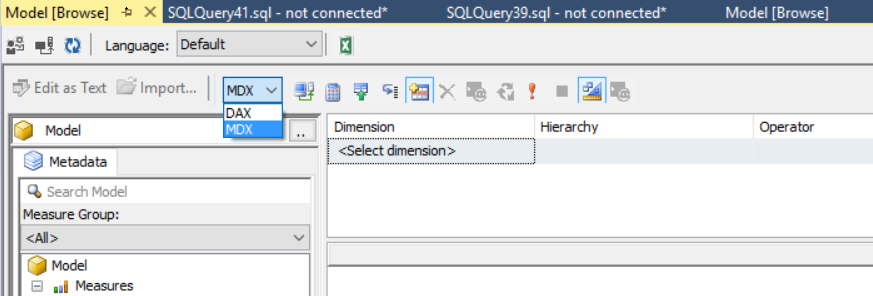
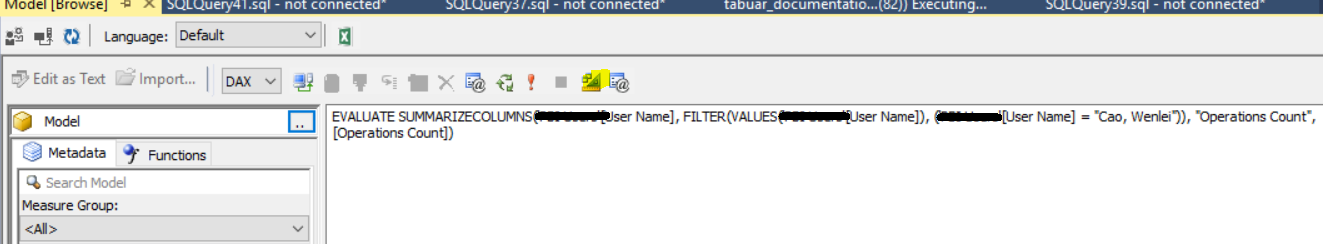
Drag and drop the attributes to window and filter as you see in the dashboard. The following is an example.

If you see same result pop up, you can click the button in yellow shade to see the underlying DAX code. You can start your troubleshooting there.
What if the dashboard is complicated?
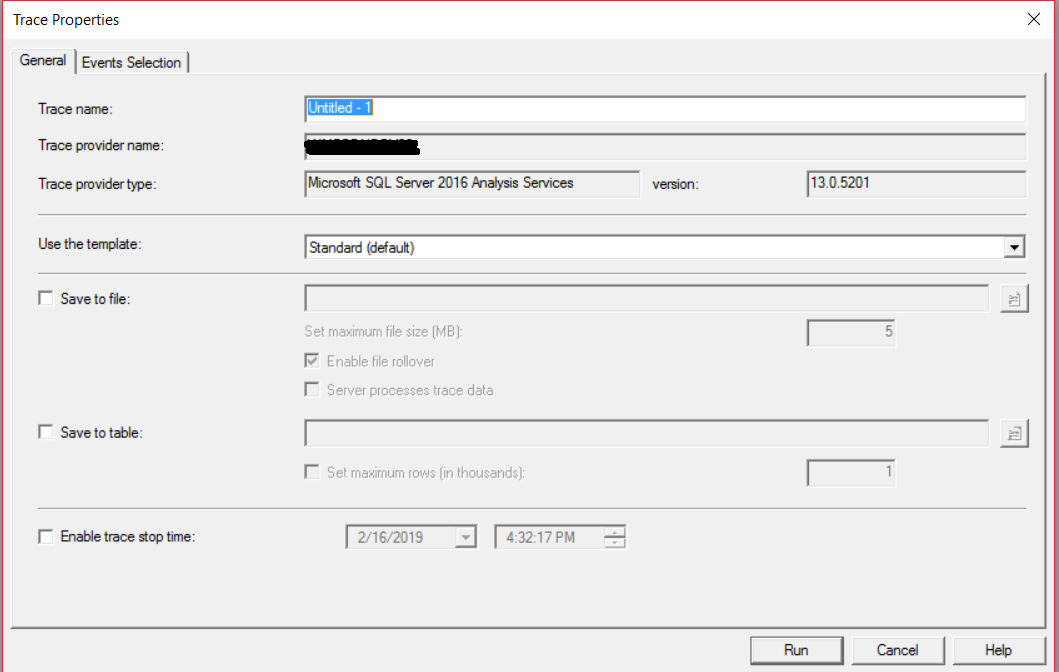
You can use SQL Server Profiler to trace the DAX query. Open the SQL Server Management Studio, from Tool menu choose sql profiler. Connect to the Analysis Service Server which you dashboard is currently connecting (fill in the AS server name where I highlighted with black). Choose the standard template. Before you hit run, let us pause for a second.
If your dashboard contains multiple visuals, you are only troubleshooting one visual. What I would do is to duplicate the dashboard page. Delete all visuals you are not interested. That way, you don’t have other DAX query running to interfere your analysis. In profiler, You can also filter the NTUserName column in SQL Server profiler to only allow your activity show in the window in case there are a lot of user out there. (see more filter topic in this link)
https://docs.microsoft.com/en-us/sql/relational-databases/sql-trace/filter-a-trace?view=sql-server-2017
When you are ready, in SQL Server Profiler, you can click run to start tracing, then run the duplicated dashboard page. In the SQL Server Profiler window, the DAX query will pop up. You can copy the query from profiler and start to do research in DAX studio to figure out why.
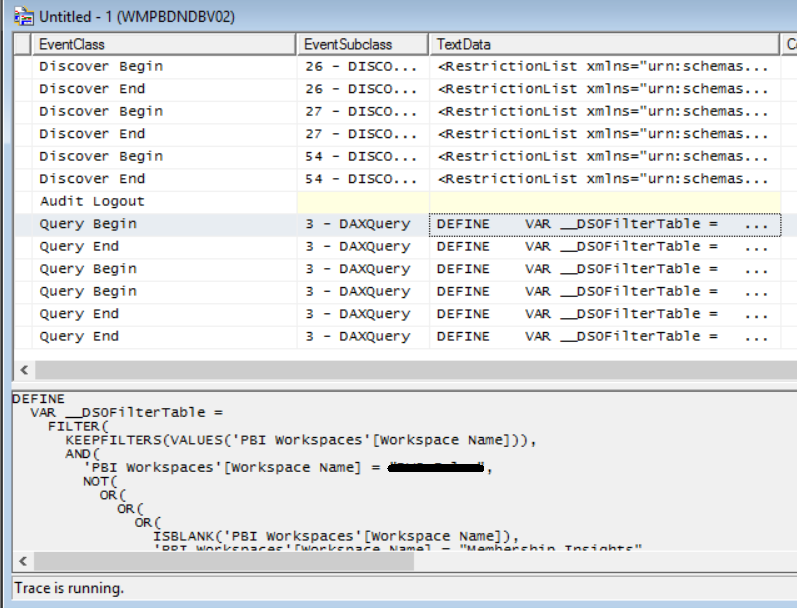
Of course, those DAX queries are machine generated queries, somewhat looks strange. You need some DAX knowledge to go further. That is not scope of this post though :).
I hope you find this post useful.
Again, Happy BI.
Wenlei